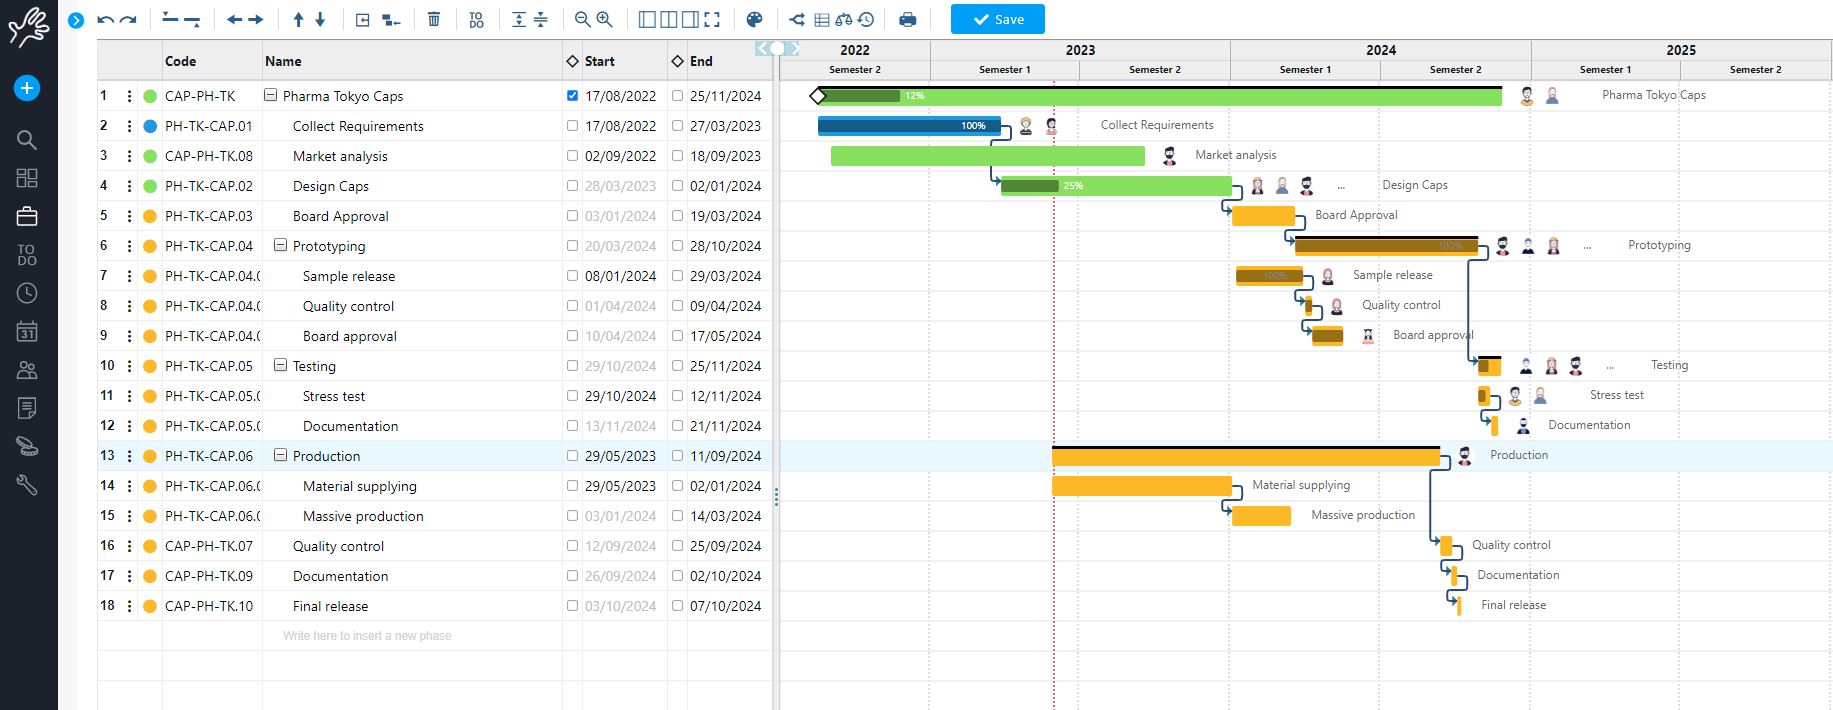
Twproject supply an easy-to-use graphical Gantt editor. You can find it at the top of the wbs bar.
You can watch the video tutorial, or follow the instructions below:

Users used to MS-Project will find the Gantt editor quite comfortable. That said there are several differences between the two data models and behavior.
Twproject focus is capturing work done in real time. For doing this we built a tool that can model real time situations and easily change in time. This is in contrast with traditional project management methodology where projects are defined in advance in all details – not realistic for most of the work situations.
Twproject’s model for project, project trees, dates and project states is different from classical Gantts one: projects can be open beyond their due dates, projects can be suspended inside their time scope, and so on. Also the automation due to dependencies has been somewhat simplified.
When you access the Gantt editor you are set at the node of the tree you are navigating in the WBS
Your changes in the Gantt editor will be saved only when you click the “save” button. This way you can “play” with the tree without modifying the original project structure.
Data grid panel
The project tree view is divided in two parts, separated by a vertical line; the two panels separator can be dragged left or right depending where you are operating. The left part is the textual panel:

Columns can be expanded by dragging them, and all contents (code, name, dates and dependencies) can be edited.
Project can be collapsed and the view is remembered by the system.
Project statuses can be changed as well using:

All types of Gantt dependencies
According to definition, in the context of project management, “dependency” is defined as the relationship between two activities in a project or between an activity and a milestone (a precise point that defines the beginning or end of a relevant phase).
Dependencies thus allow one phase to be linked to the next in a way that indicates that they are consequential.

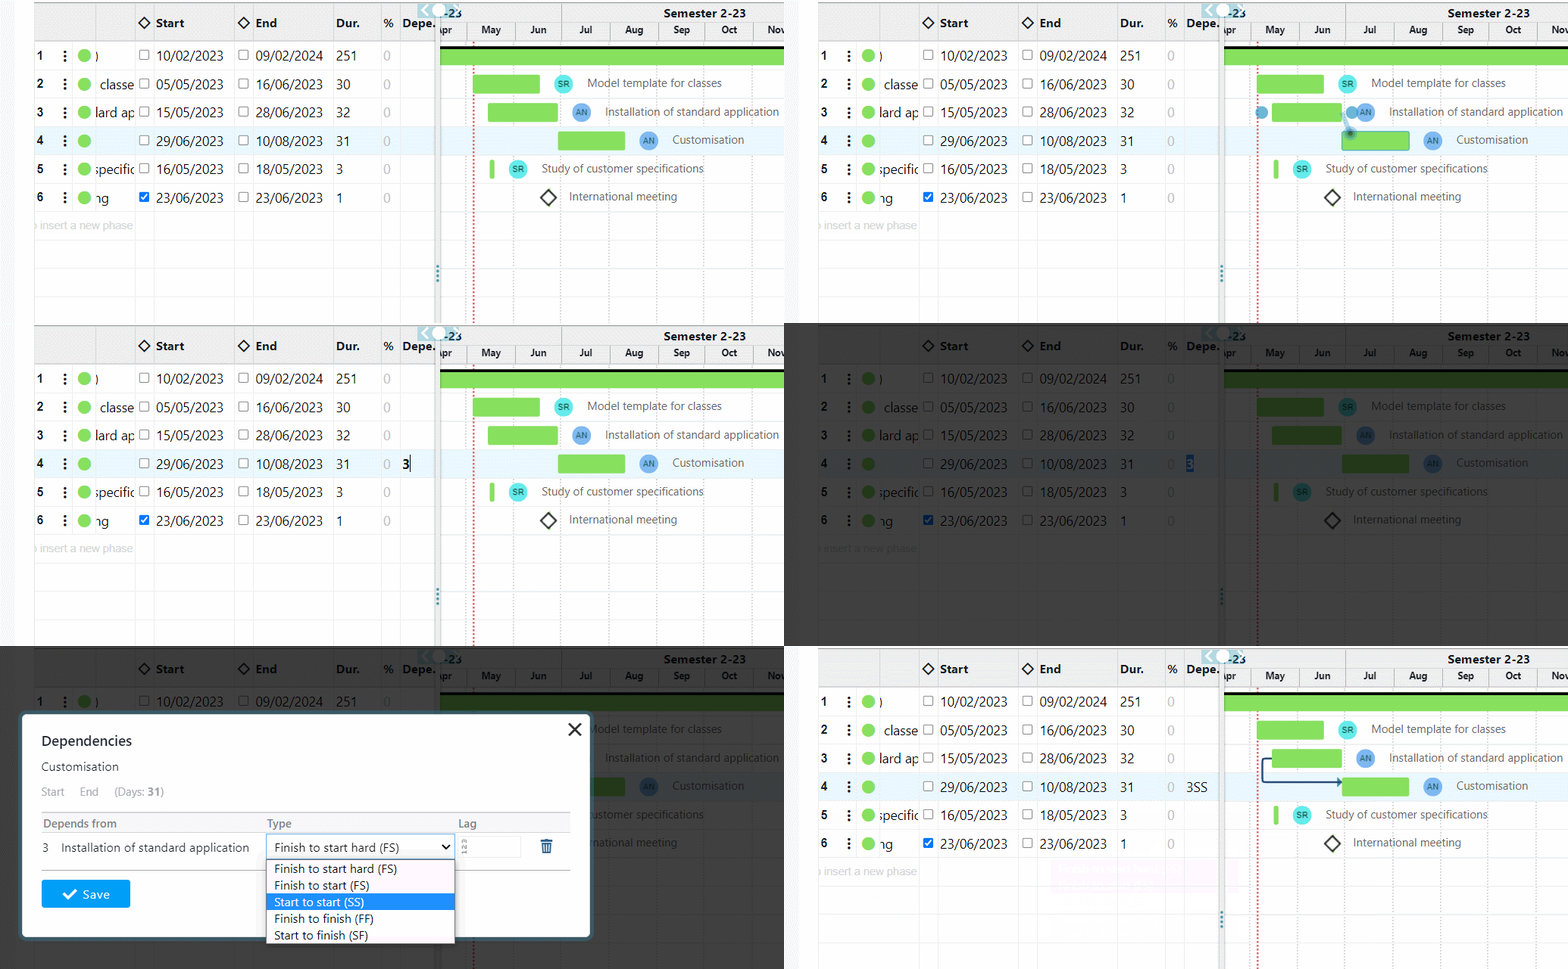
Dependencies can be introduced by simply writing the row number in the “dep” column. Using “:” after the row number you can set the lag.
You can set multiple dependencies by separating row numbers with commas.
Until version 7.1.004 Twproject, the dependencies between project phases that the user could enter were of one type, the so-called classic Finish to start (FS). This means that activity A must finish before activity B starts, or in other words, activity B cannot start before A is finished.
But as we delved deeper into this topic and also through feedback from our clients, we realized that limiting the possible relationships that exist between the phases of a project to this classic type of dependency was reductive. In fact, there are additional relationships that can develop between the activities to be performed and that have been theorized in the principles of project management. Let us look at them in detail:

- The Finish to finish (FF) relationship type implies that activity B cannot finish before A is also finished. For example, if activity B is the completion of writing a book and activity A is the writing of the last chapter, it becomes clear that A must necessarily finish for B to be considered finished as well.

- Furthermore, there is the case that a certain activity cannot begin before another activity has in turn begun, and in this case the relationship will be Start to Start (SS). A classic example is the project management activity (B) of a project that cannot start before the project itself (A) begins.

- Finally, a very specific case is the last type of relationship called Start to finish (SF), which is probably the most complex to understand and applies only in certain contexts. In this case activity A must start before B finishes, or in other words B cannot finish until A is started. Such a scenario may arise, for example, during shift change in a manufacturing plant whose machinery needs constant monitoring. The initial shift (A) cannot be said to have ended unless the next shift (B) has already started, on pain of putting the plant at risk.
We are therefore overjoyed to announce that in the new release of Twproject we have introduced the ability to assign all of the above types of dependencies to project phases.
After creating the dependency between two phases, you can possibly change the default value represented by the FS dependency and select another type of relationship.
The application of the concept of “elasticity”
Another important paradigm shift, which makes us very proud of our work, is that we have made all the newly added dependencies “elastic.”
Indeed, if until now the assignment of a dependency established the linear succession of one activity after another, we know well that in the real world the downtimes.
That is why Twproject decided to allow the user to freely manage this elasticity.
So from now on when you enter a dependency it will be saved at first with the default FS hard type. But this classic “hard” dependency can be converted into “elastic” and with any type of relationship.
This means that two interdependent activities may also not be chronologically consequential and move apart, leaving any gaps between them, or overlap for a time, as long as the logic of chosen dependence is respected.
This is a big change in terms of sticking to the facts when carrying out a concrete project and reinforces the concept of delegation that is central in Twproject.
Imagine a project tree where a Project Manager (PM) is assigned for the whole project and then a specific one for each phase, one for the analysis(PMA), design(PMG) and production(PMD) phase, these phases are linked by an FS dependency.
The PM can define a total project duration and assign a specific duration to the phases, thanks to the elastic dependencies, he can, while maintaining the logic of the dependencies, create a lag between the phases and therefore leave to PMA, PMG and PMD great freedom of action (moving end and start data) without affecting the overall dates!
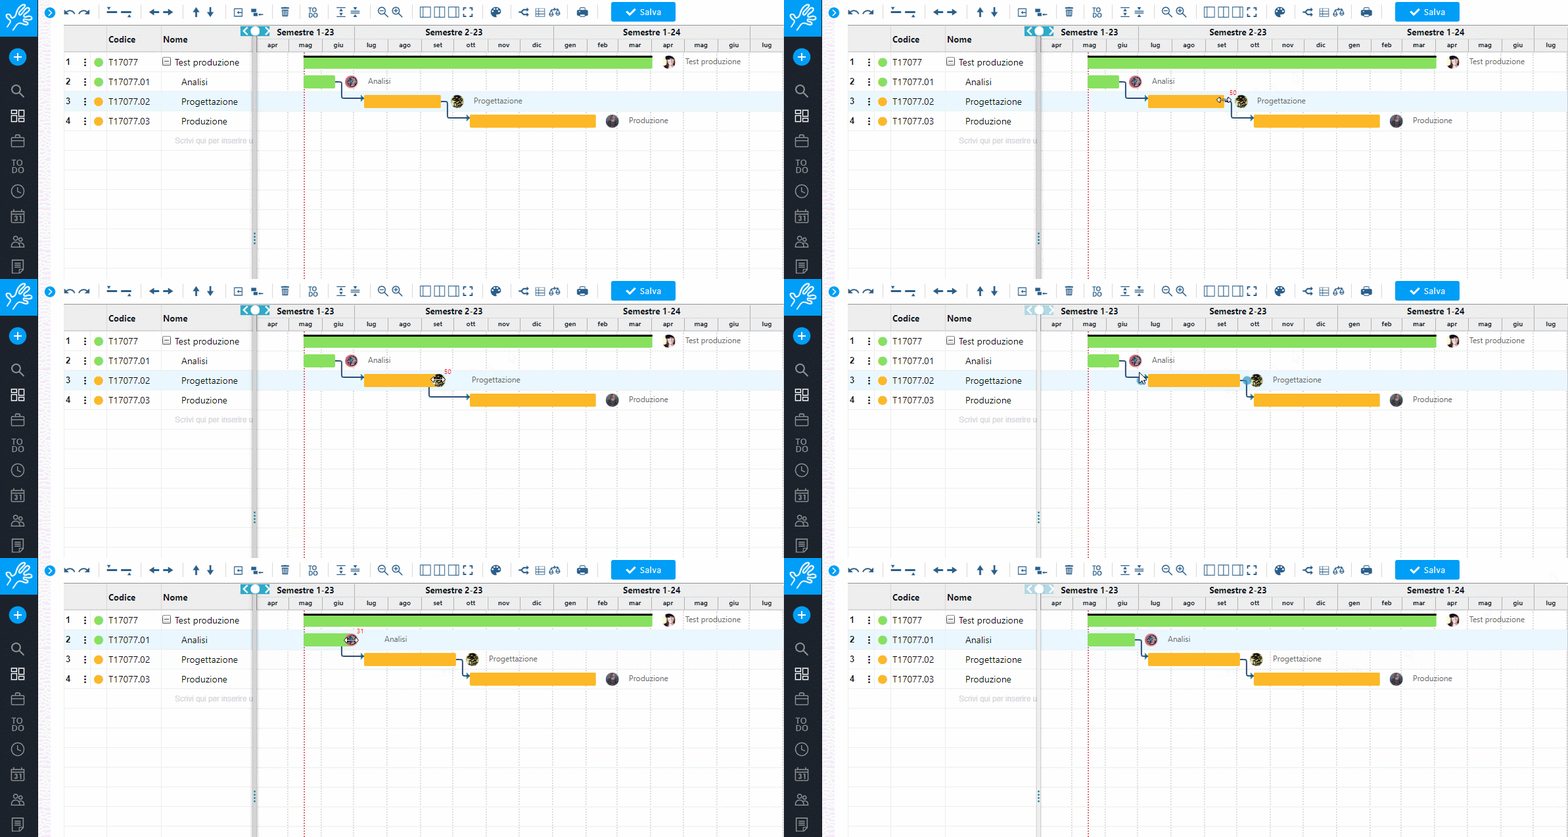
This was not possible before, since a postponement of an end date, for example of the analysis phase, would necessarily have led to a postponement of the consequent phases, phases over which PMA has no right.
Gantt chart toolbar
The button panel shown below manages the functionalities in the Gantt toolbar:
![]()
Undo-redo: quite clear 🙂
Insert above: insert a “brother” phase above the current one
Insert below: insert a child phase below the current one
Outdent: transforms current phase from child phase to brother
Indent: transforms current phase from brother to a child
Move up: move current phase up
Move down: move current phase down
Reduce Dates: reduces the dates
Back Pan: shifts starting from the end of the critical path
Delete: deletes the current task
To-Do List: allows you to view the To-Do list on the row where the focus is
To-Do Add: allows you to add To-Dos on the row where the focus is
Expand/Collapse: allows you to expand/collapse the tree
Zoom +/-: changes the scale of the Gantt panel
Division panel: show grid, show both, show Gantt
Full Screen: displays the Gantt chart in full screen
Palette: allows you to see the project and phase colors instead of state colors
Show/Hide: shows/hides columns – included custom fields
Hidden Milestones: shows hidden milestones
Critical Path: shows/hides the critical path. See below.
Show/Hide Control Bar: displays the progress of all project phases on a control line to easily highlight delays

Show Project History: shows/hides the project history, indicating whether the phases are ahead or behind schedule
Show Workload: shows/hides the workload of resources assigned to the project. See below.
Print: prints the Gantt chart of the current project with options like printing project data, trimming the Gantt chart, and printing in PDF format on a single page or multiple pages.
Show/Hide Custom Forms: shows/hides financial data in the Gantt line (budget, estimated costs, actual cost, estimated and completed worklog) – shows and hides the number of open, closed, and total To-Dos for each Gantt row.
When the current phase is highlighted, use the keyboard to move up/down, left /right, delete it by pressing ctrl+[UP7DOWN/LEFT/RIGHT] or ctrl+[DEL].
You can create or edit assignments by clicking on the assignment cell:
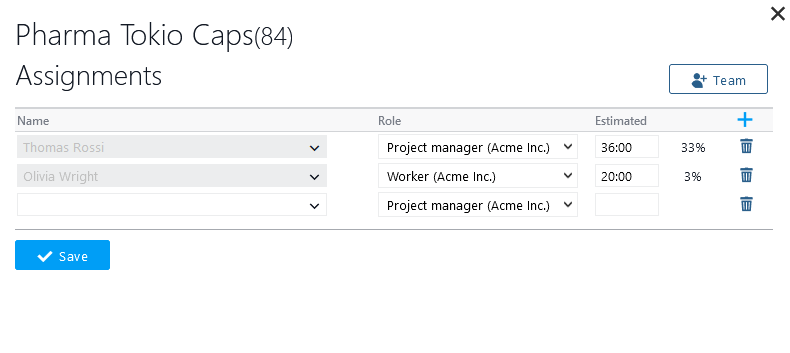
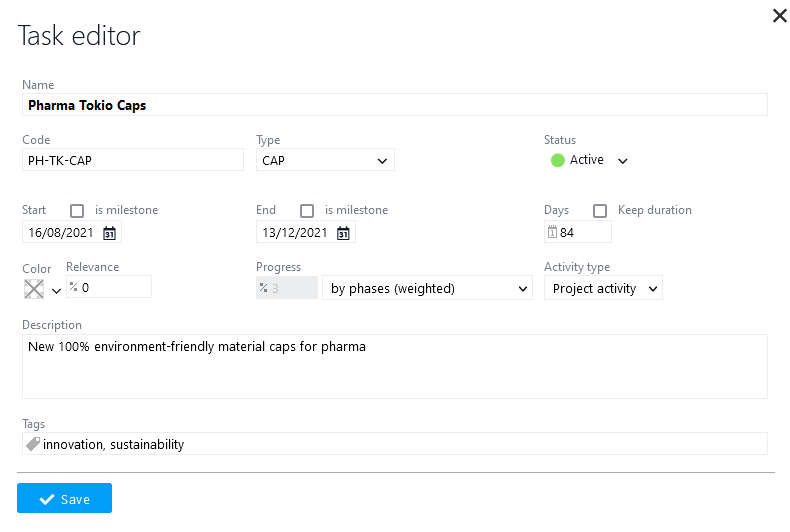
A micro project editor is accessible clicking on the row number.
Gantt panel
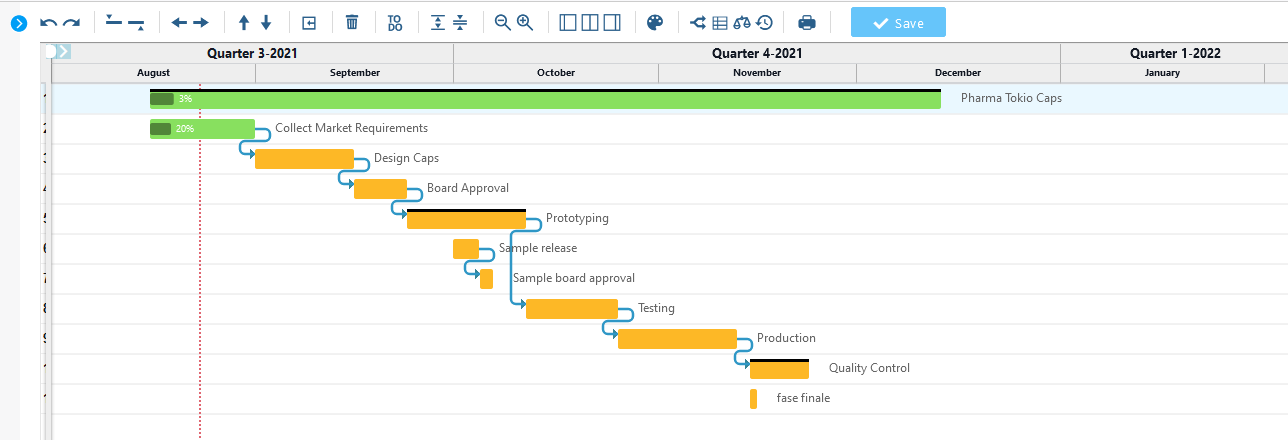
On the right panel, where project’ duration is shown graphically, you can move phases in time by dragging them, and all dependents will be moved accordingly – if possible.
If you stop with the mouse at the start or at the end of the project/phase, the mouse cursor will become a bi-directional arrow and it will be possible to expand / contract the phase duration by dragging. All dependent phase dates will again be changed accordingly if possible.
 All operations are checked with the project constraints and done only if possible. If for example you have a milestone set, it will not be possible to move.
From the Gantt panel you can create dependencies by dragging the “dots” to other phases.
To create child phases, you just need to write their name in the “name” column:

Then you set start and duration either by dragging or by writing dates by hand.
You can use drag and drop to create dependencies
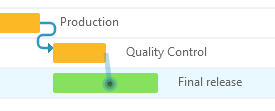
Notice that phase statuses are updated correspondingly.
Copy, cut and paste on Gantt chart

The possibility of copying and pasting project phases into the Gantt chart allows you to carry a lot of information together and considerably speed up the work of the project manager.
With this new function in Twproject, all ‘master’ data relating to a project branch and phase assignments to resources are copied.
In addition, the process maintains internal dependencies on the copied branch if it has sub-phases.
But let us see how to do this in detail.
All cut/copy/paste functions can be activated by clicking on the options icon on the chosen line, or by simply positioning the cursor on the line and typing ctrl+C, ctrl+X, ctrl+V.
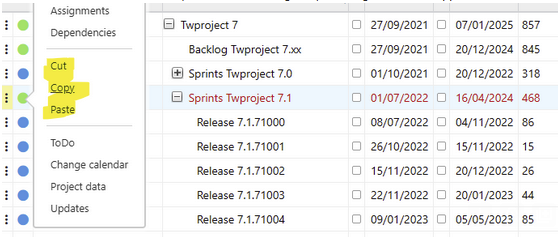
Next, we must position ourselves on the target line and paste the content.
If pasting on an existing line, the block is copied as a ‘child’, whereas if pasting on an empty line, the block is inserted at the current level.
The selected block remains in memory so that it can be copied several times, to facilitate work when there are several lines to be pasted, and the ESC key finally switches off the selection.
This function is compatible with the undo/redo commands and therefore allows you to do various operations, until you finally save and the Gantt is recorded.
Manage workload on Gantt
With workload button ![]() , you can activate a functionality to see all assignee on each phase with percentage capacity. Red users are overloaded.
, you can activate a functionality to see all assignee on each phase with percentage capacity. Red users are overloaded.

Near each name you will find how much the resource is loaded and how this percentage is composed (load from this project, load set on all the other projects).
![]()
Thanks to these information you can reschedule phases with overloaded resources.
You can Also use the magic wand near end date to have a suggestion from the system, that, considering all assignments for overloaded resources will give you a possible new end date.

Baselines
On the left of “Save” button there is a special clock icon to open the Gantt baselines slider. Thank to it you will be able to see how project was scheduled at the beginning.
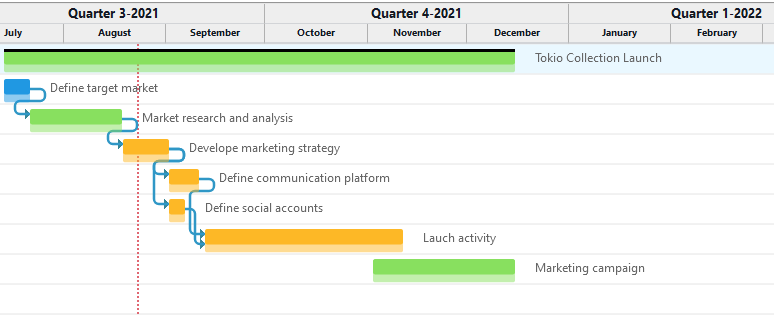
A lighter bar will appear below every project, that bar will move showing changes in time.
Gantt and ToDo list chart viewable together
We have introduced a new view to simplify meetings and allow working on ToDos directly from the Gantt. Check out this dedicated video.
The extended list ToDos list in a side tab to the Project Gantt

Choosing the “ToDo list” button in the navigation bar will open a second navigation window, which can be displayed alongside the current one. This new window will show the extended list of ToDos related to the phase you are currently in.
By clicking on the various phases within the Gantt, the list will update showing the ToDo’s for each selected phase.
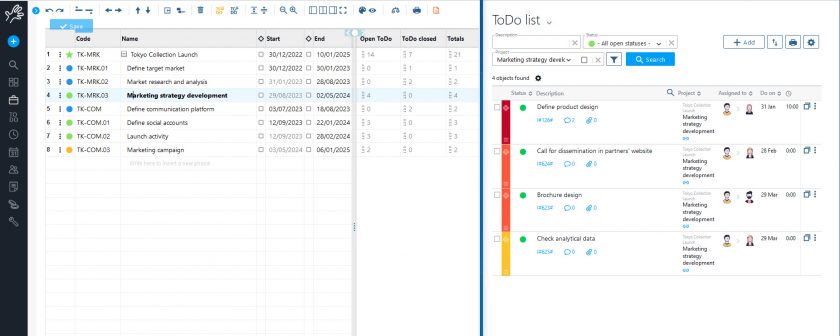
By default, the list shows open ToDos for active phases and closed ToDos for completed phases. But this display can of course be changed using filters. For example, if you also want to see closed tasks for a phase that is still in progress, just set the filter ‘Status’ to all so that you see the complete list of open, closed, or else, ToDos.
From this window you can also act on the ToDo list as usual, adding items to the list, changing assignments, dates, priority, etc.
The ToDo summary for each phase while consulting the Gantt
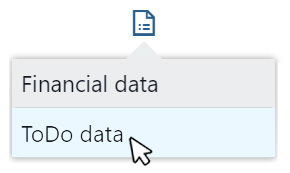
By clicking on this icon in the horizontal function bar of the Gantt, and selecting ‘ToDo data’, it will be possible to display a summary of the ToDo status for each individual project phase in a new column of our Gantt.
The overview will show a column with a summary of the ToDos (open – closed – total) for each individual phase. And all this will be visible without having to open additional pages.
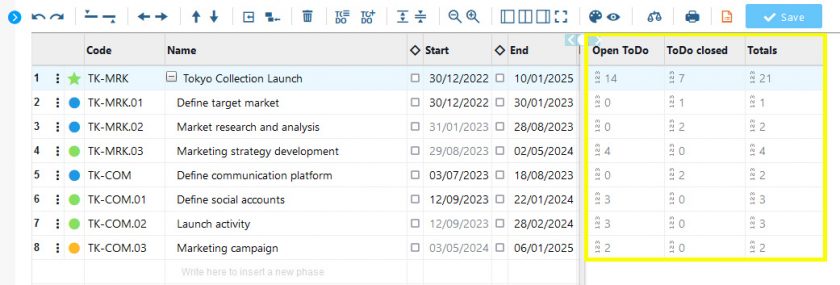
This new way of reading the Gantt and ToDo summary together is useful to see at a glance where delays are accumulating and/or where there is the greatest active workload.