In Twproject, you can always monitor the workload of your resources or your department, as much information you set in Twproject as much your graphics will be close to reality.
You can watch the video tutorial, or follow the instructions below:
The first thing you need to say to Twproject is how much you intend to work on a project: an estimation. This estimation can be set on assignments – that is already quite fine grained. If you are breaking down the project with ToDos, you can even estimate by quantifying each ToDo.
The estimation is set as an agreed result, is a way to get people involved and committed: it is a public commitment. So it is useful even if it turns out to be inaccurate.
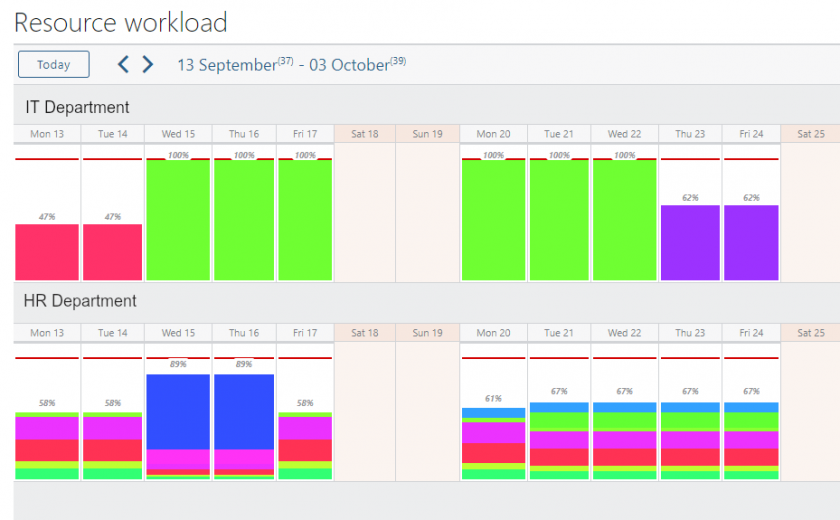
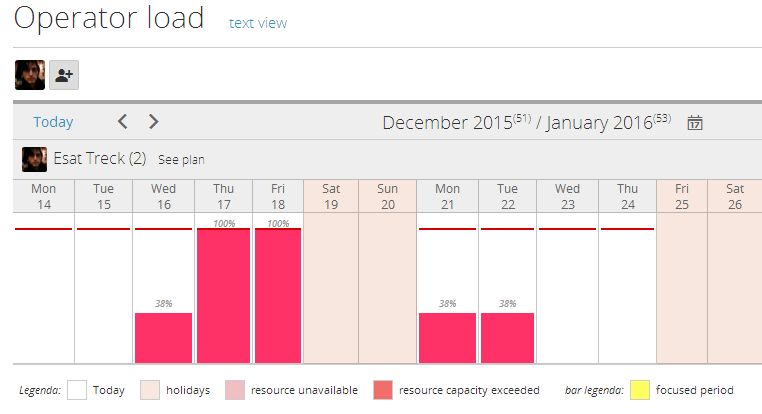
Now, from the workgroup section click on “operator load”, you’ll get something like this:
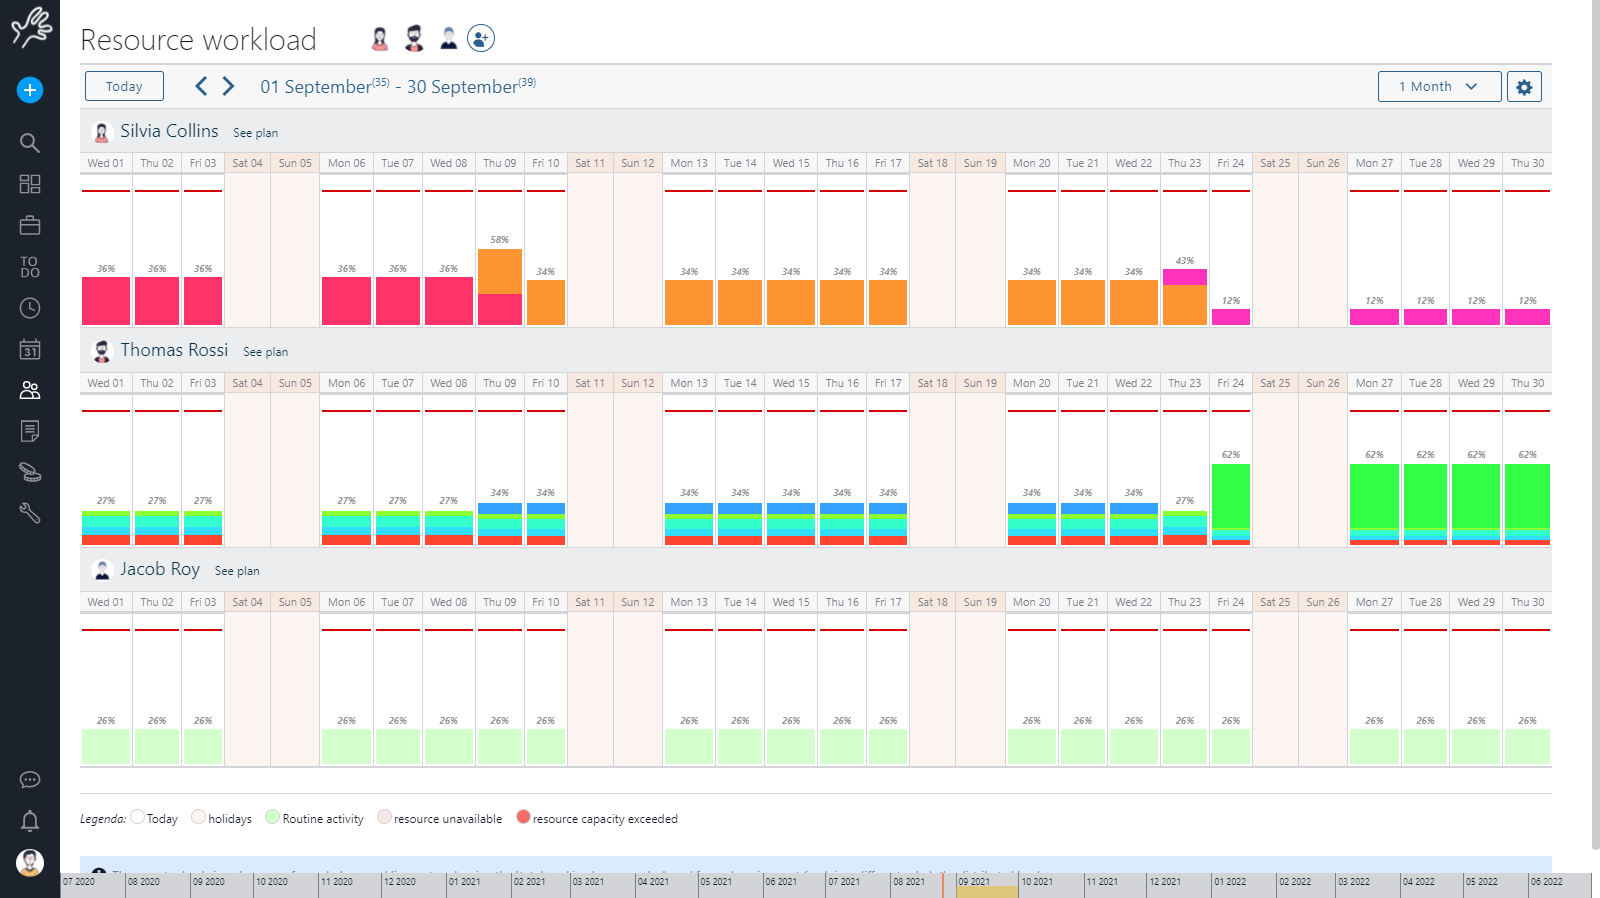
In this page for every resource in the selected workgroup you will get a graphical representation of the load total by day, every color represent a different project. By clicking on a column you will get a detailed explanation of the components of the load.
This is a 1 month view, there is also “one week”, “2 weeks”, “3 weeks” available. You can even move in time by clicking the bottom bar or add someone to your workgroup by clicking workgroup.

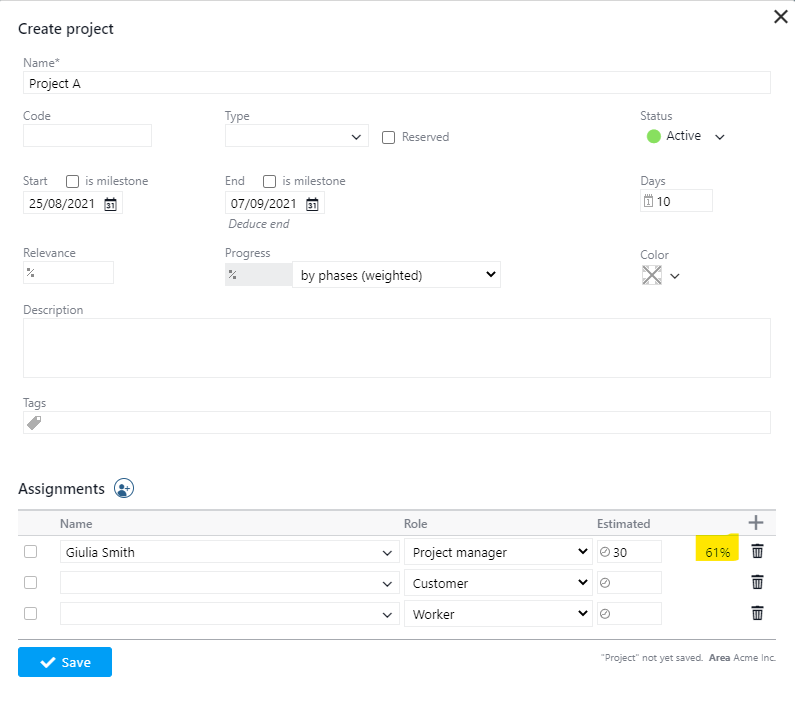
The work load information is available every time you create a new assignment. When you will chose one of your resource you will immediately know her work load, so deciding which will be the best resource to assign will become much easier.
To describe clearly how Twproject calculates the work load for a resource let’s see a practical example:
Say we have two projects:
– Project A lasting 5 days with a resource assigned (Resource R1) with an estimated worklog of 25 hours.
– Project B lasting 2 days with a resource assigned (Resource R1) with an estimated worklog of 12 hours.
Project in the future:
This is the simplest case:
– One single project (Project A)
– No unavailability events in the project period
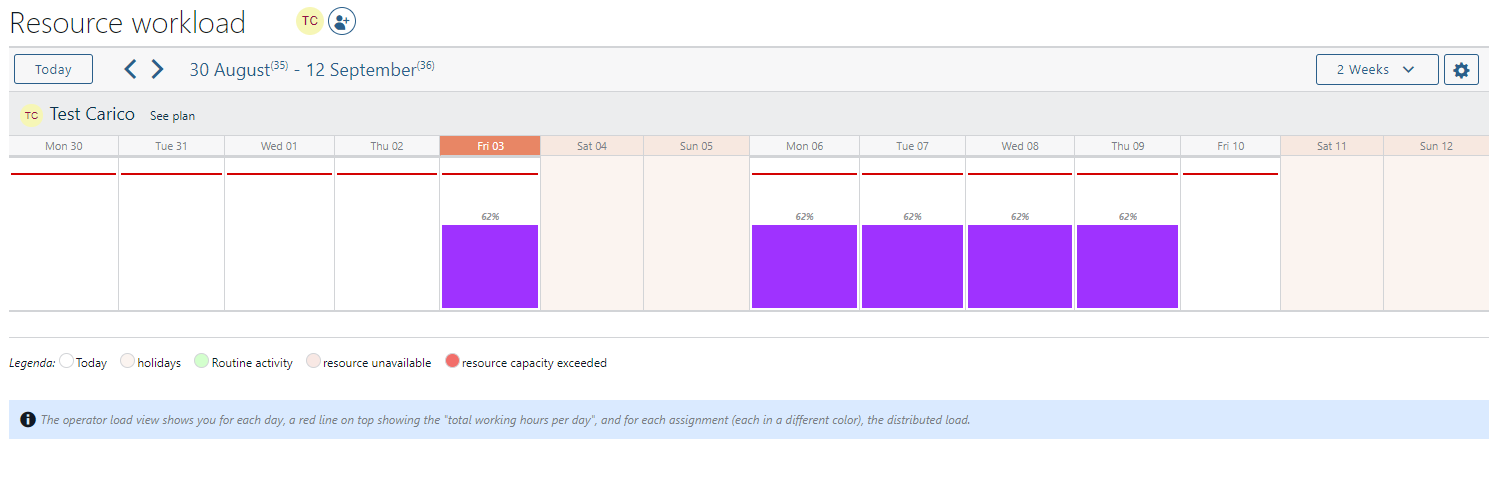
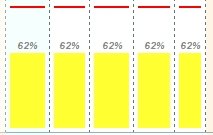
According to this data the work load will be distributed equally in the five days (5 hours per day).
The percentage represents the estimated worklog for that day according to the working hour per day of the resource (represented by the red line).
Here is the load for Project A:
Now we can consider a more complex case:
– 2 different projects (Project A and Project B) having intersected period assigned to our R1
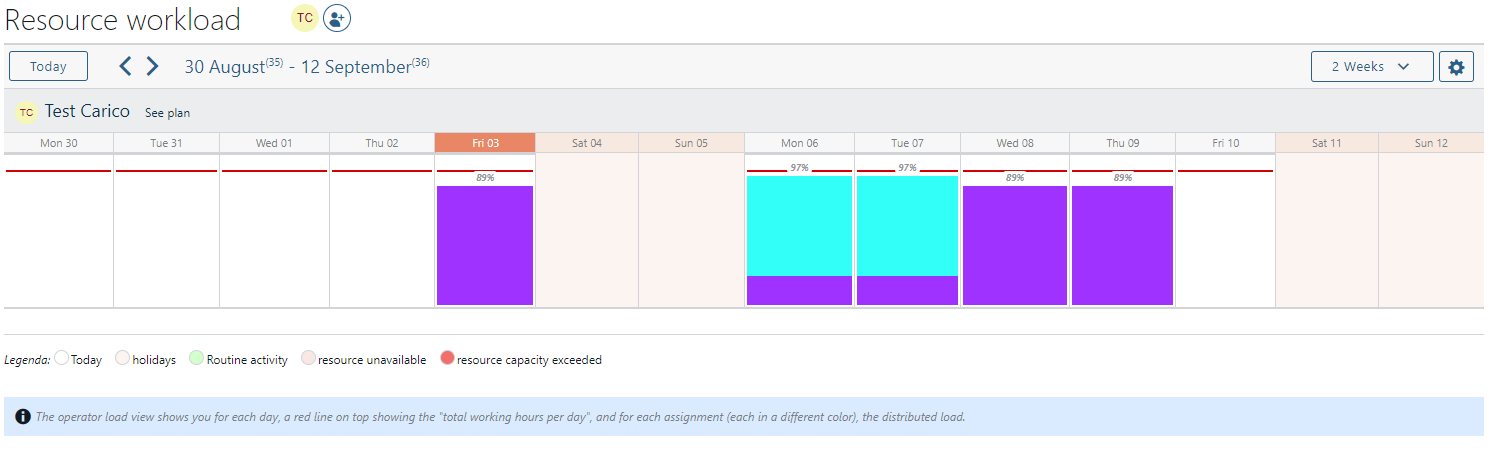
You see the load of these two projects below.
As said before:
Project B lasts 2 days with an estimated worklog of 12 hours which should generate 6 hours per day of work.
Project A lasts 5 days with an estimated worklog of 25 hours which should generate 5 hours per day of work.
  |
 |
As you can see from the picture Twproject does not simply sum the two estimations for each day but tries to distribute the work load so that the resource does not exceed his/her working hours per day, in this case by increasing load in the less booked days.
Project in the past:
The main difference looking at the operator load including projects in the past is that in this case we have to consider also the work done and not only the estimated one.
The picture below shows again the load of Project A (moved to intersect today).
If we consider again a simple case (a single project without unavailability events) and we suppose that the resource has correctly inserted the worklog here is the result:
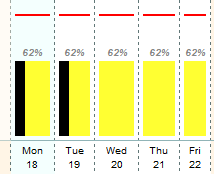
The dark bar represents the inserted worklog.
The total estimated worklog was 25 hours, we already did 10 hours (5 hours on Monday 13 and 5 hours on Tuesday 14) so we still have 15 remaining hours which have to be done in 3 days.
In this case the load still shows you five hours per day also for the future days.
Now we consider what would have happened if the resource had not recorded worklog for Tuesday.

As the estimated worklog for Tuesday has not been done the load for the next days increased.
The total estimated work was 25 hours, we did 5 hours (instead of 10, there is not the grey bar on Tuesday) so we have 20 remaining hours of work which have to be done in 3 days, this is the reason way the load for the future day is increased to 83%.
It is possible to measure the workload of a department
As we have already mentioned, assigning a department to a project has always been possible, but its function was only to grant permissions to people who were part of the department/section (permissions are those given by the role with which the department is assigned).
Resources could not log hours worked on the department but required their own assignment.
Belonging to a department assigned to a project will give you the ability to report directly on this assignment; you will be able to see the project and work with the ToDos.
Measuring the workload of a department naturally requires that the company registry has been created properly and that you filter for the workgroup of your interest, in my example “IT Department.”
The advantage of this feature is being able to assign a department without worrying about who will handle the specific activities, knowing that all those who belong to it are fully operational on it.
In work environments with large teams and where Agile working methods are used, it will be very convenient to have a single assignment on which everyone reports.
Even assigning a ToDo to a person will no longer create an assignment to the person if that person is part of a department/team already assigned to the project.
In the worklog analysis interfaces, however, the details of the people who reported on the department assignment are shown, keeping all the analysis, control, and approval procedures unchanged.
This is a new default behavior of Twproject and therefore does not need to be activated.
Consequently, in all interfaces where your assignments are shown or where you can log your work, in addition to personal assignments, those of the directly related department are also shown, with the possibility to report on them.
If a person also has their own nominal assignment on the same phase, the department assignment is ignored, and only the personal one is shown.
The workload calculation in Twproject takes into account a number of essential parameters: dates, the status and type of projects, the estimate of assignments, hours planned through the plan and/or ToDos, hours actually workable considering leaves, holidays, and sick days, and hours already worked for each individual assignment of each department member.
The algorithm, once these data are analyzed, strives to optimize resource allocation, aiming to provide a representation of the workload as close to reality as possible.
This is based on various factors, including the hours actually worked by the resource (both individual and departmental), the daily working capacity (which takes into account the working hours and can vary from day to day), and the overall load, calculated as the sum of all contributions.
Assignment type
As described in assignments chapter, in Twproject there are 3 different types: “project”, “routine”, “spot”.
This type of assignment has a major impact on load distribution.
As seen above, the worklog entered by resources has an impact on the load that adjusts accordingly over time (“project” type), this algorithm cannot be applied to all types of activities, for example some, even if not carried out, do not accumulate over time, these activities are considered “routine”, distributed equally over the entire duration of the project regardless of the work inserted.
There are also activities that cannot be estimated / planned, but which can still occupy the time of a resource in an unpredictable way. This type of activity is managed with the “spot” type, which even with an assignment estimate to 0 is included in the load against a ToDo entered with an estimated date and time.
Plan
If you use the plan to organize the estimated worklog we have to introduce an important consideration:
Let’s use again the simple example of Project A (again it has been moved in the future):
Here is what you see when you enter in the plan for the resource R1.
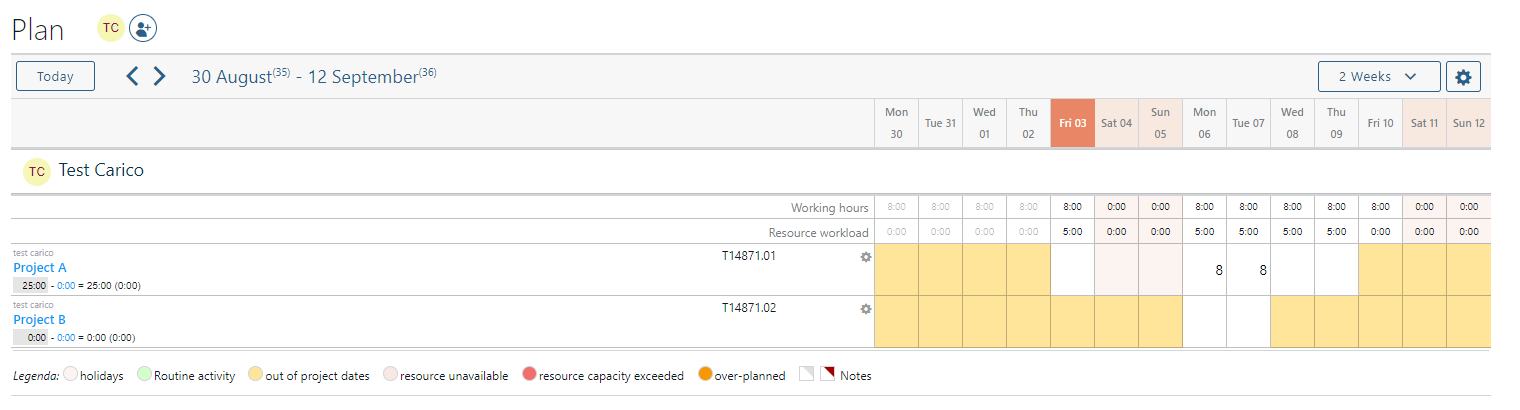
The first row represents the operator load that is there to help the user to correctly insert the plan.
In this case we are looking at a future project so the estimated work is distributed equally through the project days.
Now we supposed that we want to work on project A for 8 hours on Thursday and Friday
Here is the result on the operator load:
The pictures show that according to the plan the operator load is changed; in fact we have a load of 8 hours for the two days selected and the remaining hours are distributed on the 3 days left.
What we hope to have shown is that plan and load interact and get filled up from every possible source in real time – which is Twproject’s focus.