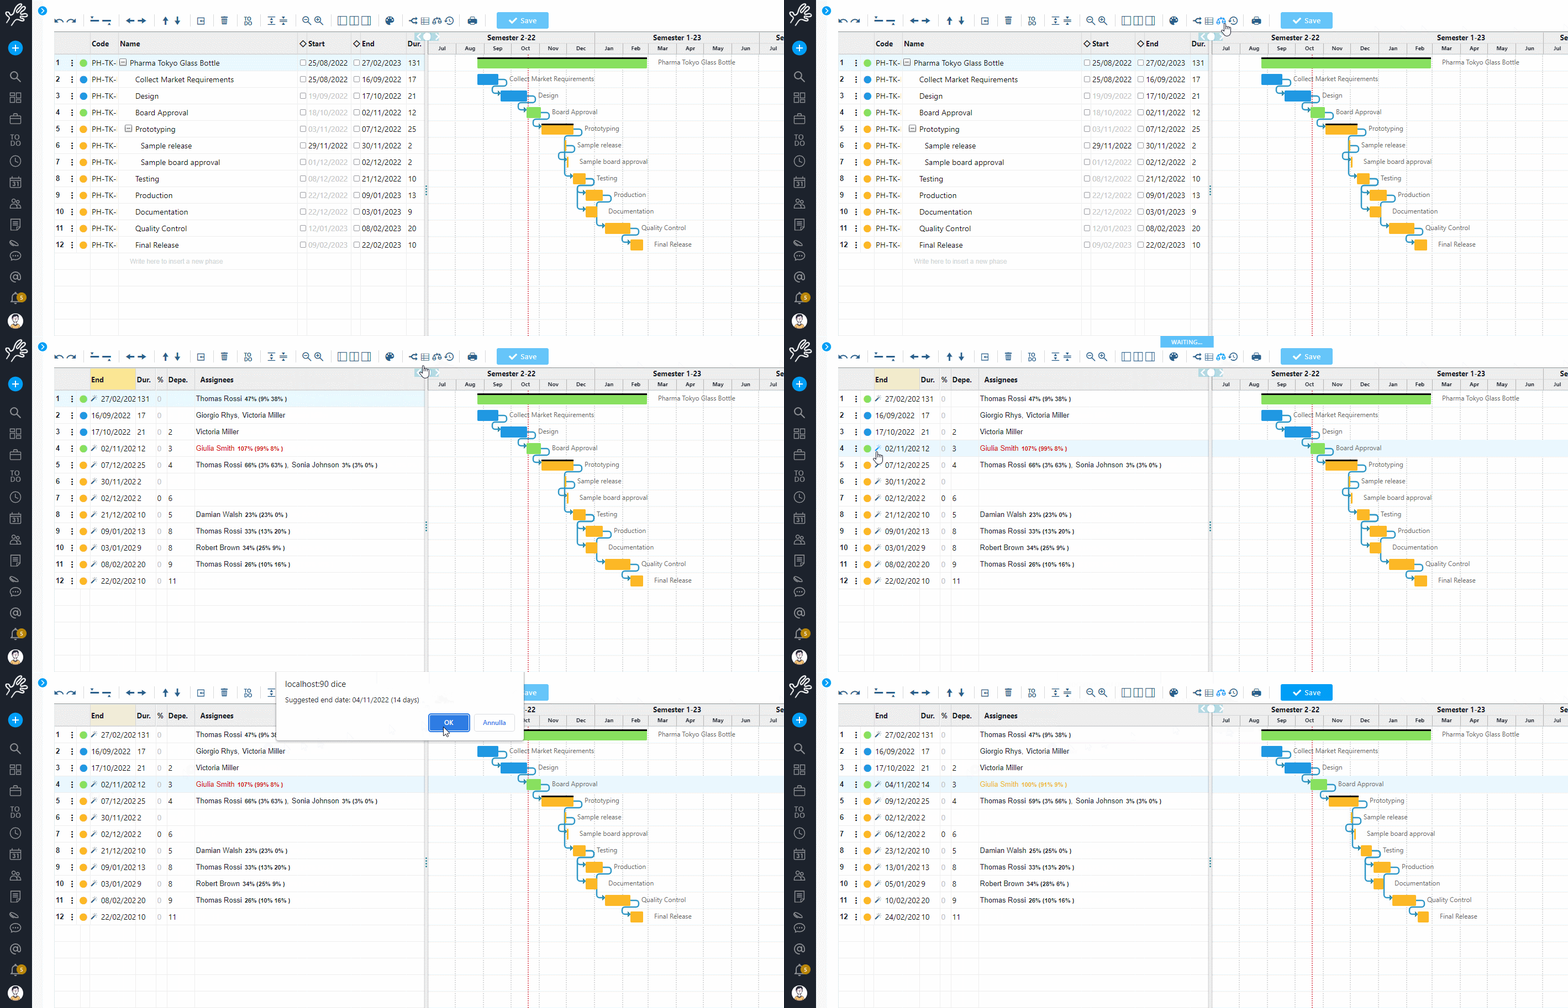
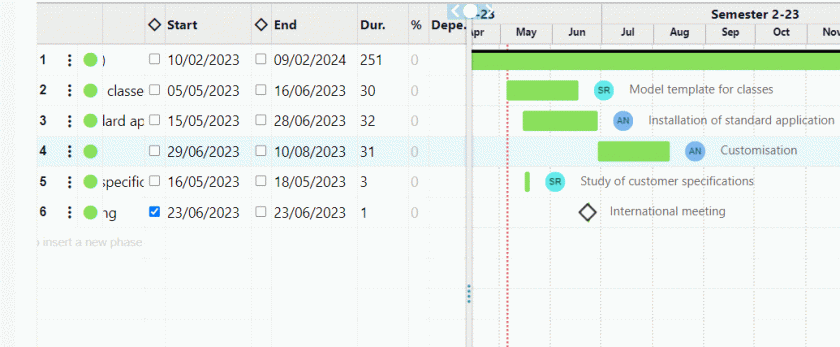
The best tools to create Gantt charts

How can we create a good Gantt chart and what are the best tools for implementing and managing it?

In this article, we will try to answer this question. We will also try to prove that Gantt charts are not only useful for initial planning, but also for managing ongoing projects.

How will we do this? Simply by showing you some tools that, in addition to create beautiful Gantt charts, also integrate highly effective project management features.

The main features we will encounter relate to the management of human resources involved in the project and to financial planning.

But now let’s get into the details and see the reasons behind creating a Gantt chart and the best ways and operational tools to do it.

What is a Gantt chart used for?

The Gantt chart is a tool that was developed in the early decades of the 20th century and has undergone numerous changes since then.

From the outset, it was represented as a bar chart for planning project phases.

In the Gantt chart, here is what the two axes represent:

  • Horizontal axis: outlines the time frame, which can be divided into days, weeks or months.
  • Vertical axis: represents the activities, or phases, into which the project is divided.
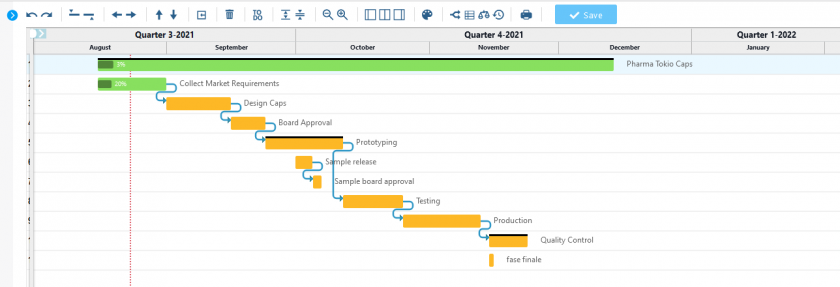
creazione diagramma di Gantt

In summary, the Gantt chart is the reference point for the temporal allocation of tasks to be carried out for a project.

While initially this was just a chart showing initial activity planning intentions, with the advent of calculation software and later web tools, Gantt charts became an operational tool.

Today, its role does not end with planning, but continues throughout the project’s execution.

How to create a Gantt chart?

So, what are the main steps for creating a Gantt chart that also takes into account possible developments in the project and their implications for the various areas of business management?

Here is a brief list of the main steps.

1. Project definition

  • Clearly define the objectives, purpose, and constraints of the project.
  • Set an expected start and end date.
  • Involve the key stakeholders to gather requirements and expectations.

2. Subdivision of the project into activities (WBS – Work Breakdown Structure)

  • Break down the project into phases, then into main activities and finally into sub-activities, thus defining your project tree, or Work Breakdown Structure.
  • Each activity must be clear, measurable and have a specific result.

3. Setting the duration of activities and milestones

  • Estimate the duration of each activity (in days or weeks), considering realistic times and avoiding overestimates or underestimates.
  • Establish milestones, i.e. crucial events or targets planned during the course of the project.

4. Identification of dependencies

  • Determine the logical order between activities:
    • Finish to Start (FS): a task must finish before another can start.
    • Start to Start (SS), Finish to Finish (FF), etc.
  • Use arrows or lines to connect dependent activities.

5. Allocation of human resources

  • Assign one or more team members to each activity.
    Consider:
    • Staff availability
    • Specific skills required
    • Sustainable workload
  • Plan for any training or hiring if skills are lacking.

📌 Inefficient use of resources can lead to bottlenecks and delays. Use tools that allow you to check the workload of resources.

So far, we have seen the basic features of Gantt charts, which every tool for creating them normally has.

But let’s take a step further and see what additional or desirable features are not native to Gantt charts but add extra value and make a chart set up in this way truly efficient.

We have identified three in particular:

6. Cost estimation and financial management

  • Associate each activity with an estimated cost, including:
    • Personnel costs
    • Material costs
    • Overhead and indirect costs
  • Prepare an overall budget for the project.
    Also include spending milestones (e.g., billing dates, fund disbursements) in the Gantt chart

📌 Integrate Gantt with a cost control tool to compare planned costs and actual costs during the project.

7. Monitoring and updating

  • Update the diagram regularly based on actual progress.
  • Enter:
    • Activity status
    • Delays or advances
    • Changes in resources
  • Compare planned vs. actual.

8. Communication with stakeholders


What are the best tools to create Gantt charts?

The creation of a Gantt chart is therefore a complex process, which begins in the initial planning phase and continues throughout the lifecycle of the project.

The data in the Gantt chart comes from multiple sources and covers different areas of project management.

In fact, along with the increased interactivity of Gantt charts, the range of resources involved in using and consulting the diagram has expanded.

Given that various professionals are involved, we believe that a good Gantt chart creation tool should have the following main features: integration of multiple functions and sharing of operations.

So now let’s move on to the ranking of the best tools to create a Gantt chart, keeping in mind the aspects we have highlighted so far, and see which ones help us do our job better.

1. Twproject
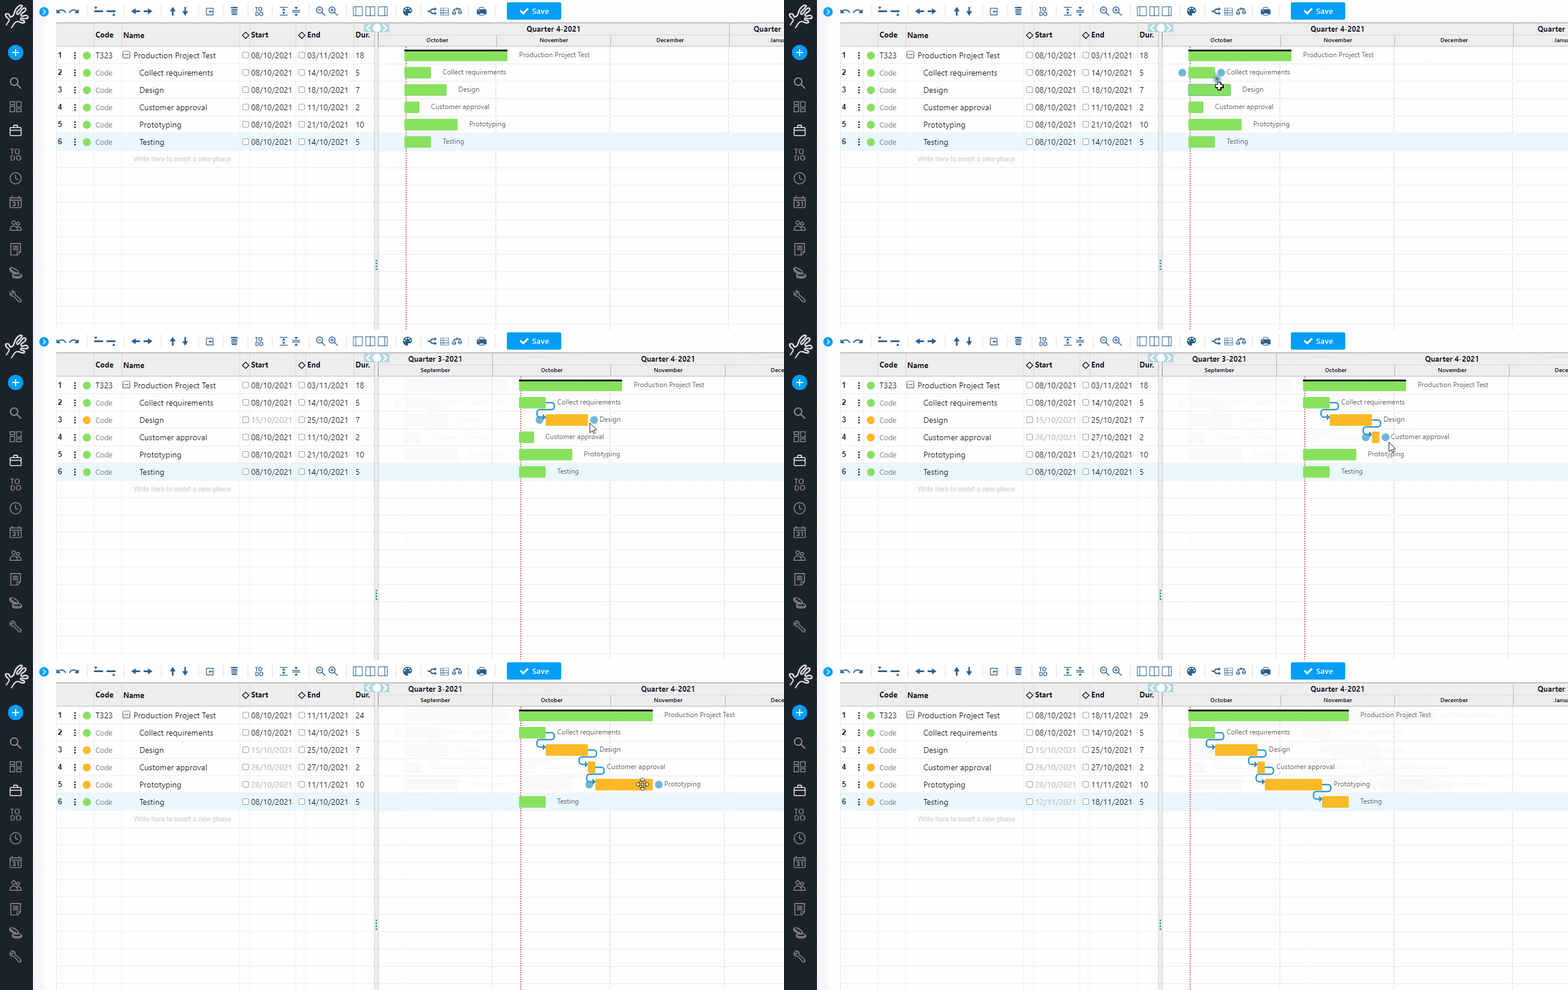
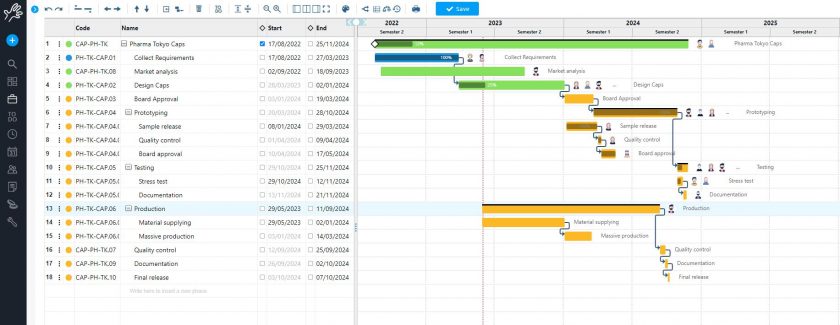
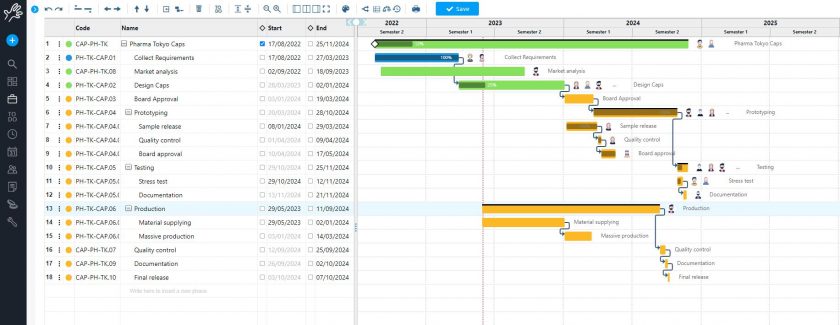
create a Gantt diagram with a tool such as Twproject

Twproject is a tool designed to create a customisable and dynamic Gantt chart that tracks project progress and helps streamline operations.

Considered by many to be the best Gantt chart on the market, Twproject has made this tool its flagship product.

The Gantt features that can be created with Twproject range from the ability to optimise resource workload and easily identify bottlenecks, to planning project costs, to managing micro-tasks (ToDo’s) associated with each phase.

The ability to set dependencies between phases in a very flexible and adaptable manner ensures that the system can be tailored to any business environment and, in particular, to meet the needs of accurate planning.

The Gantt chart created with Twproject is an operational tool that can be updated at any time and keeps track of all changes made over time, comparing them with the initial plan.

Finally, it offers numerous sharing options, both through reports and real-time updates, which are useful during project meetings to keep teams and stakeholders up to date.

Key features:

  • Multiple creation modes: via WBS or directly on the diagram, by dragging and dropping blocks;
  • Overview or detailed view: different levels of detail and the ability to zoom in on individual phases;
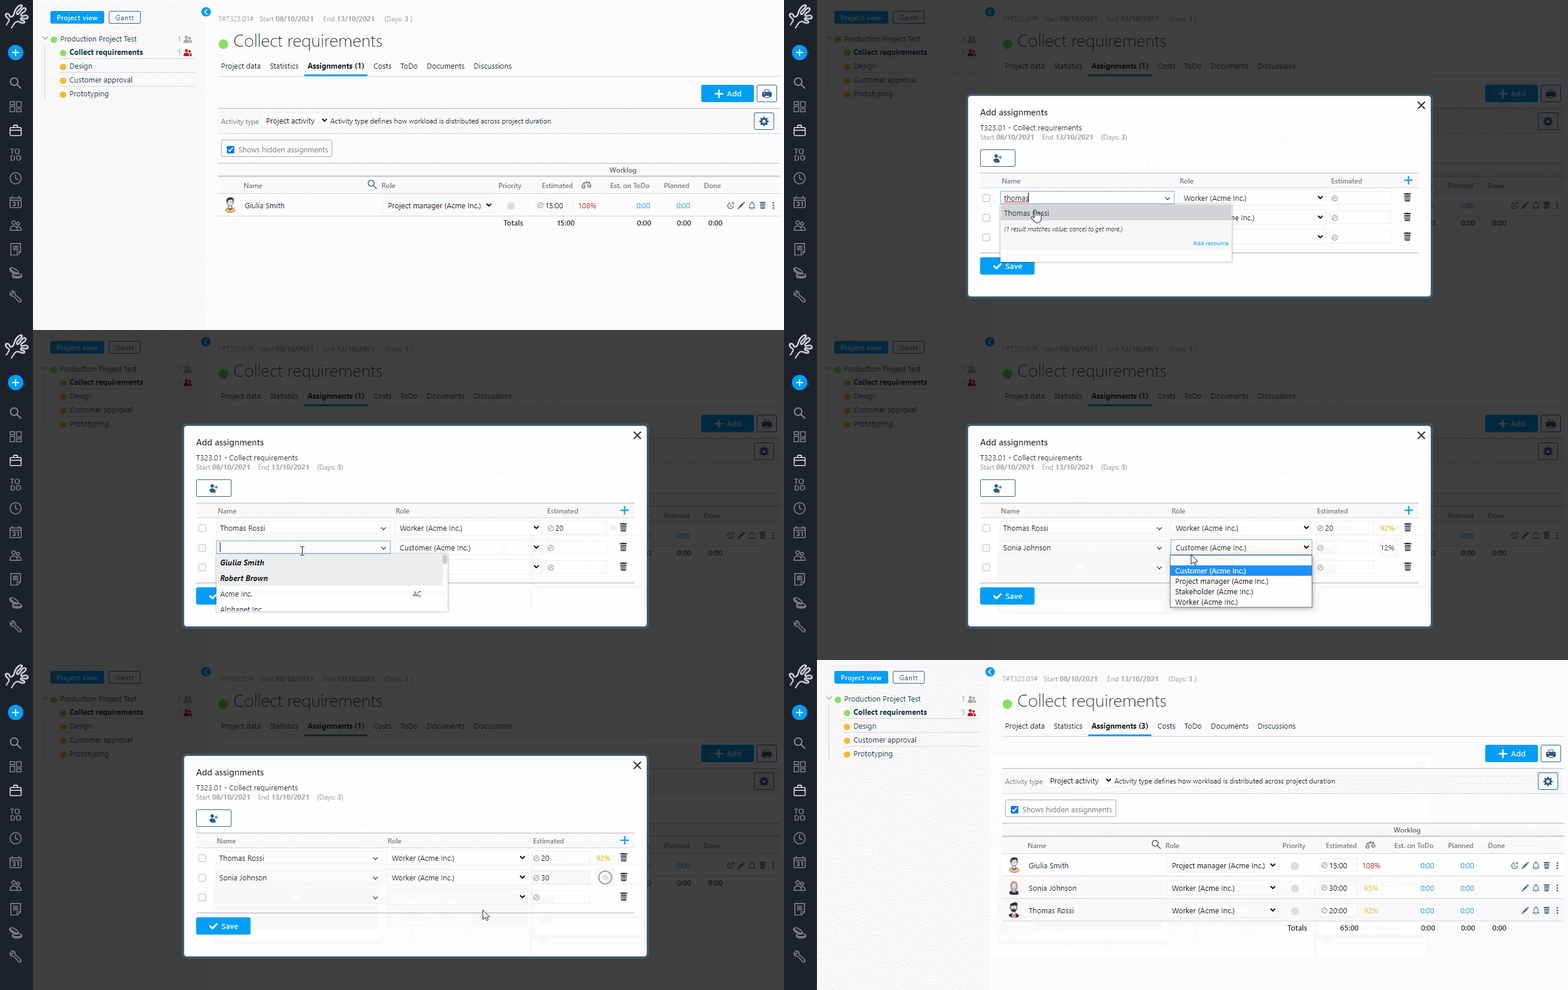
  • Resource allocation: setting phase assignees with a real-time view of the workload;
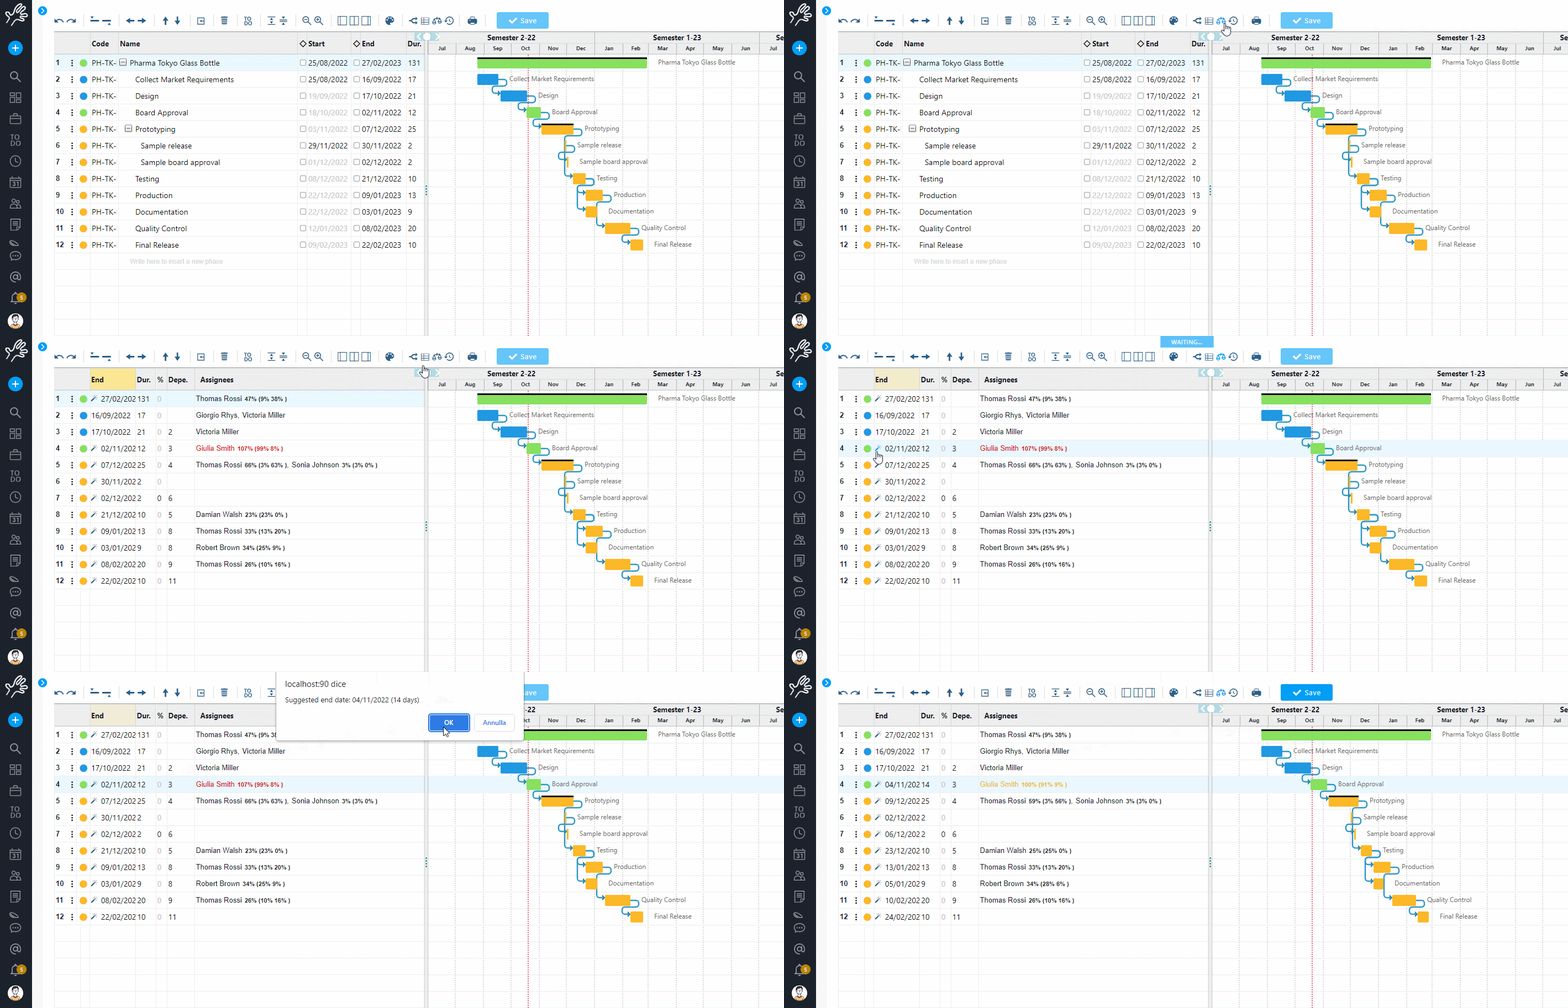
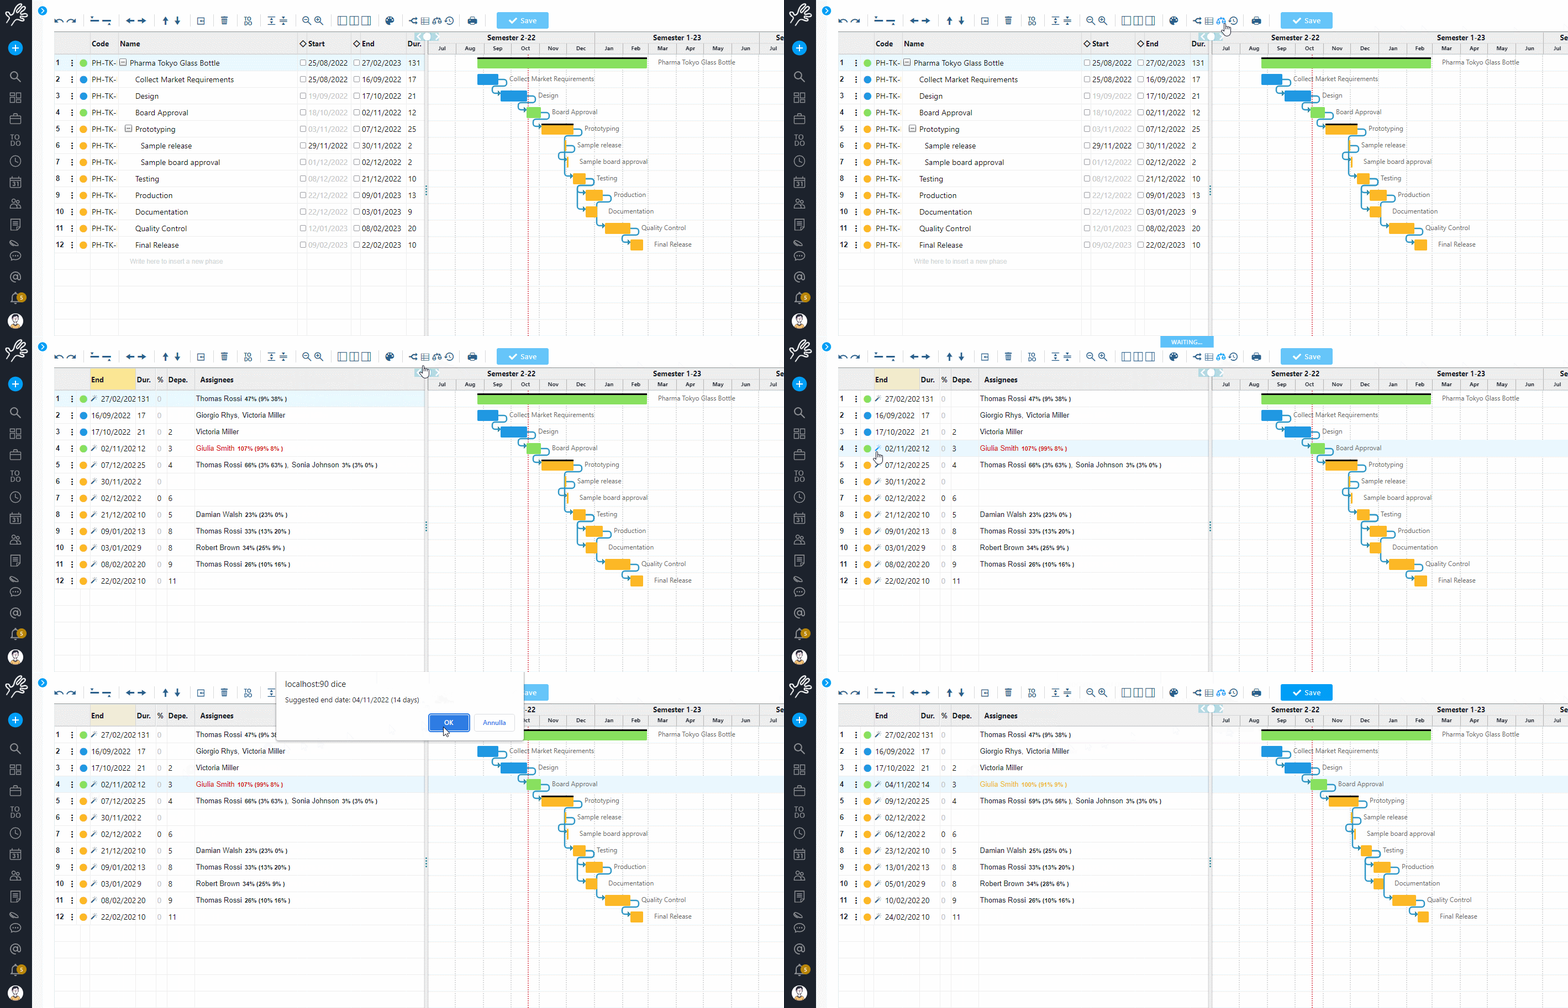
  • Overload resolution: automation that allows you to optimise timing based on resource availability;
  • Critical path: algorithm for displaying crucial nodes in project development;
  • Timeline: history of changes made to the Gantt chart throughout the project lifecycle;
  • Dependency types: Finish to Start, Finish to Finish, Start to Start, Start to Finish;
  • Flexibility: possibility of having dependencies between non-sequential phases;
  • To-do view: integrated display of open and closed project activities for each project phase;
  • Financial data view: display of budget and estimated and actual costs for each phase;
  • Role and permission management: possibility of assigning the planning of various phases to different users;
  • Sharing: exportability in various formats and with optional data integration.

Price: starting from €4.89 user/month.

Pros: it is possible to create a Gantt chart in just a few clicks and integrate the information entered with all other software management tools. Its Gantt chart adapts to any way of working and helps keep the project team aligned at all times.

Cons: no cons to highlight.

360° planning thanks to a useful tool for the daily operations of structured project management.

2. Trello + Planway
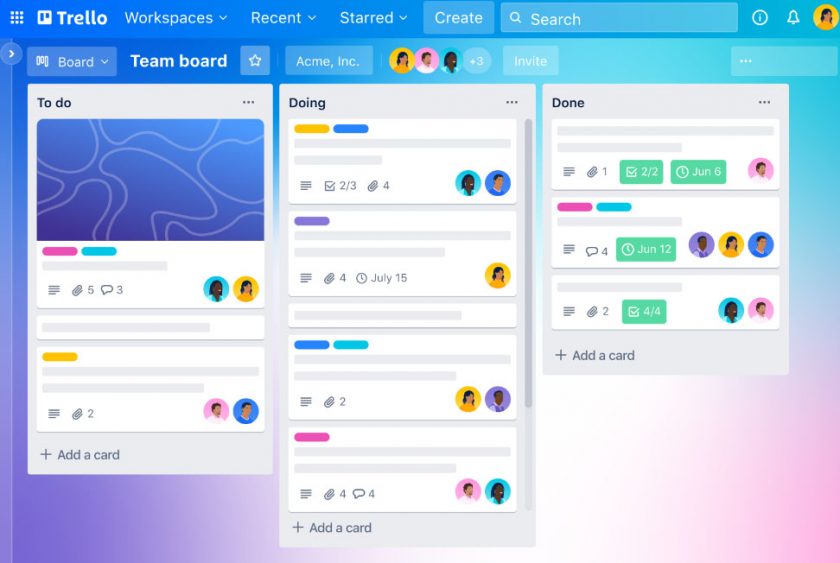
Trello is a card-based project management tool designed to offer visual and simple project management. For creating Gantt charts, Trello can be extended with power-ups such as Planyway, which add a time view to the tasks on the boards. This integration allows users to transform classic Trello cards into elements that can be planned on a timeline.

The Gantt view obtained through power-ups allows for better management of deadlines, dependencies between tasks, and the distribution of work over time. Each task (card) can be assigned to team members, given start and end dates, and monitored visually in the context of the overall project. This helps maintain consistency between the initial plan and actual progress.

Trello is especially useful for teams that already use a Kanban or Agile methodology, thanks to its flexibility and ease of use. Although Gantt features are additional and not native, integration with external tools makes it a good choice for those looking for a compromise between agile methods and Gantt planning.

Key features:

  • Management of start dates and deadlines;
  • Assignment of team members to each activity;
  • Progress tracking and shared timeline;
  • Drag & drop activities onto the timeline;
  • Automation with Butler for repetitive activities;
  • Notifications and integration with tools such as Slack, Google Calendar, etc.

Price: starting from $9 user/month.

Pros: intuitive interface, suitable even for those with no project management experience.

Cons: unsuitable for managing highly complex or long-term projects.

A lightweight but effective visual solution for project planning.

3. Smartsheet
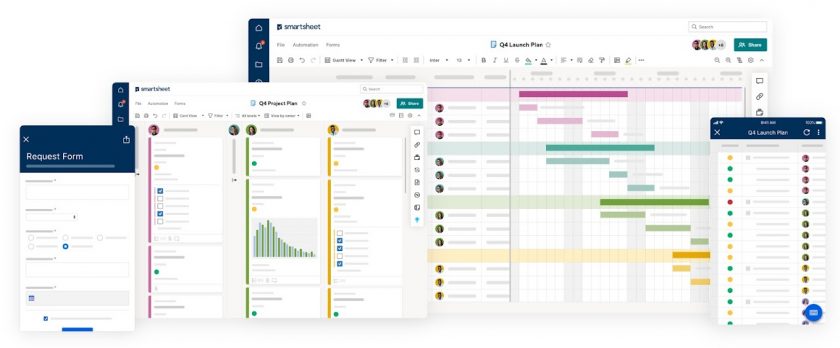
Smartsheet -  software per diagrammi di gantt

Smartsheet was created as an advanced alternative to traditional Excel spreadsheets, incorporating many of their features but tailoring them to business management. Its goal is to offer a more flexible and collaborative solution compared to traditional calculation tools.

The software combines several components into a single platform, integrating advanced project management features. These include tools for planning, task assignment and activity monitoring, designed to support complex teams and organisations.

Once the data has been entered, it can be viewed in various ways, including the Gantt view, which is useful for tracking the progress of projects over time. However, to take full advantage of its potential, you need to be familiar with formulas and calculation logic.

Key features:

  • Customisation of phase colours;
  • Conditional formatting that allows you to set custom rules for viewing phases;
  • Zoom levels: quarter – month – week – day;
  • Secondary views: list, calendar and board;
  • Critical path;
  • Percentage of work completed shown on the phase;
  • Task duration: only shown when dependencies are activated.

Price: starting from $8 user/month, for up to 10 users.

Pros: wide range of project management features, Excel-like interface, which makes it easy to adopt for those accustomed to spreadsheets.

Cons: requires a good level of expertise, especially for advanced use of formulas and features.

Technical tool with advanced features, but quite complex for beginners.

4. GanttPRO
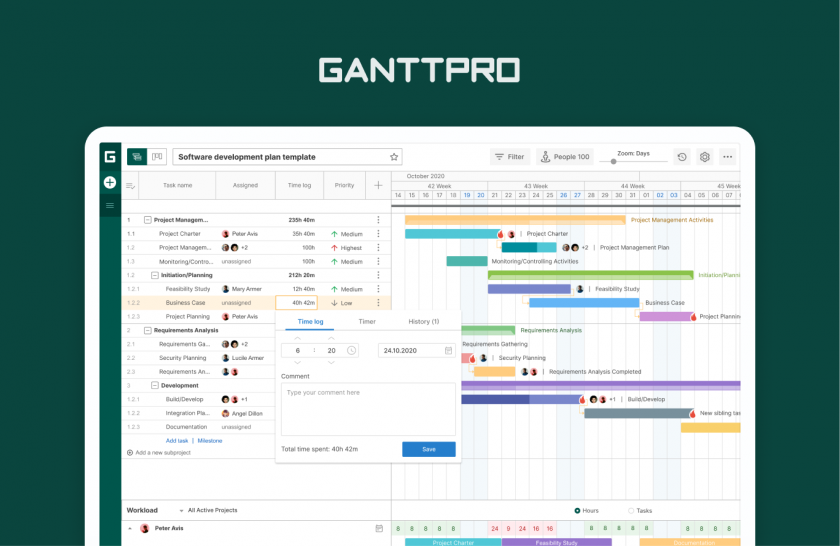
Gantt PRO - software per diagrammi di gantt

GanttPRO stands out for its approach that is entirely focused on management through Gantt charts, in stark contrast to other more generic tools. As the name suggests, it is designed to offer visual and detailed project planning from the very first use.

The work structure is based on the Gantt view as a starting point, accompanied by a WBS (Work Breakdown Structure) that allows the project to be divided into activities and sub-activities. Users can thus easily build a hierarchy of tasks and organise their work in an orderly and consistent manner.

In addition to Gantt charts, the software also offers additional views, such as Kanban boards, workload management and reporting tools. However, advanced features such as cost control and time tracking are only available with more comprehensive paid plans.

Key features:

  • Fixed hierarchy consisting of projects and task lists;
  • Option to create different baselines;
  • Percentage completed can be set on the task by dragging;
  • Dependencies with Finish to Start or Start to Start types;
  • Gap between dependencies can be set in hours;
  • Critical path.

Price: starting from $7 user/month.

Pros: fully Gantt chart-oriented, it offers clear and easy planning even for those who are not experts in project management.

Cons: less suitable for managing non-linear workflows, somewhat outdated graphics.

Specific tool to create Gantt charts but lacking in integration with other management tools.

5. Toggl Plan
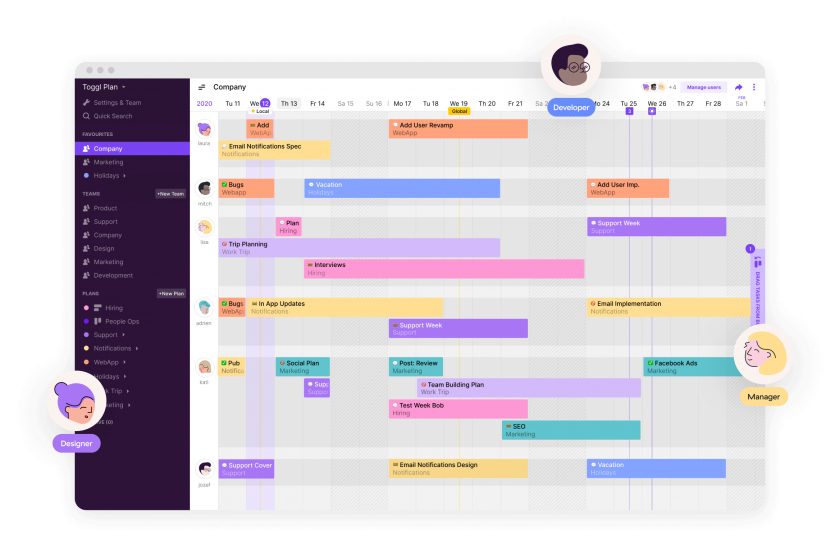
Toggl Plan -  software per diagramma di gantt

Toggl Plan places a strong emphasis on human resource management within projects, offering tools designed to optimise individual and team work organisation. Its structure is particularly useful for those involved in coordinating people rather than just activities.

One of its strengths is the integrated Gantt editor, which allows you to easily plan tasks and assignments, simplifying the distribution of activities over time. However, management is not limited to the project timeline, but also extends to the scheduling of the resources themselves.

A distinctive feature of Toggl is the ability to create Gantt charts focused on resources as well as projects. This makes it particularly suitable for those tasked with balancing workloads and optimising the use of human resources within the organisation.

Key features:

  • Estimated progress vs actual progress;
  • 4 zoom levels;
  • Drag and drop for duration and dependencies;
  • Customisation of assignment colours;
  • Data sharing, even with external users;
  • Integration with resource loading with side-by-side view.

Price: starting from $8 user/month.

Pros: good tool for human resource planning, with Gantt charts also focused on individual workloads.

Cons: perhaps due to its simplicity, it is less suitable for managing complex technical projects or those with many dependencies.

Simple and user-friendly, most useful if projects are planned based on resource capacity.

6. TeamGantt
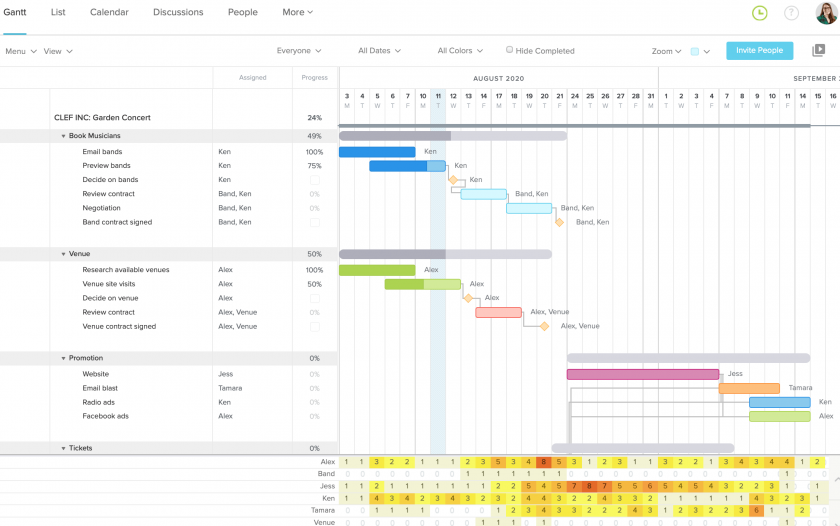
Team Gantt - software per diagramma di gantt

TeamGantt also adopts a Gantt chart-centric approach, which is the starting point for every new project. From the outset, the interface guides the user through the scheduling process, making the Gantt chart the operational heart of the tool.

Activities are added later, along with their assignment to team members. Most operations can be performed directly from the Gantt view, which allows users to edit, move or update activities with just a few clicks, providing immediate visual management.

However, the tool has some limitations. Tasks and ToDo’s are not differentiated, which can create confusion when managing activities. In addition, all activities related to a project remain visible on the timeline, which can complicate reading and organisation in more complex projects.

Key features:

  • Ability to add notes and attachments to stages;
  • Manual or automatic entry of completion percentage;
  • Workload view linked to Gantt chart;
  • Total view of the number of tasks assigned in hours or days;
  • Health report;
  • Secondary views: list, calendar and board.

Price: starting from $49 manager/month.

Pros: detailed and specific tool for creating Gantt charts, with some customisation options and good collaboration.

Cons: lack of certain types of dependencies and absence of the concept of elasticity. Poor overview.

Suitable tool for those who need to create many Gantt charts for small projects, but somewhat lacking in more complex cases.

Bottom line

As we have seen, there are now several software tools available to help you create a good Gantt chart that keeps pace with the evolution of this tool over time.

In this short but detailed list, we have tried to provide you with a general overview of the main features of the best tools to create your Gantt chart, to help you choose the one that best suits your specific needs.

We have also highlighted the some extra but crucial points in implementing the Gantt chart, which, if not overlooked, will allow you to use this tool throughout the entire project life cycle.

To sum up, keep in mind that:

  • A good Gantt chart is now suitable for any type of work, whether it is Waterfall or Agile. You just need to find tools that are flexible and adaptable to your business needs.
  • Having a precise and shared schedule helps the entire team align on project status and objectives, so favour systems that facilitate sharing.
  • The ability to have an updatable timeline that also allows you to trace back to the planned situation at any time, right from the start of the project, is essential.

Twproject has all this and much more: that’s why it ranks first among the best Gantt chart creation software tools.

If you like, you can tell us if this analysis was useful and start creating a Gantt chart right away with all the tools and features offered by Twproject.

Try Twproject free for the first 15 days and plan your projects with ease and precision!

Kanban vs Gantt: features and uses compared

Kanban vs. Gantt are two popular tools in project management that can significantly improve efficiency and effectiveness.

Both are valuable in different ways and have pros and cons.

In this article, we will compare their features and uses.

What is a Gantt chart?

A Gantt chart provides a clear overview of project progress.

Project managers can break down complex projects into smaller, more manageable tasks  through this tool. 

The chart visualizes each task as a horizontal bar, with its length representing the duration required for completion.

Arrows symbolize dependencies between activities and show the order in which they are to be completed.

Resource allocation can also be displayed in the Gantt chart.

By assigning resources to specific tasks, project managers can, therefore, ensure that the right people are working on the right activities at the right time.

Here is a list to provide a clearer understanding of the benefits and limitations of Gantt charts:

Pros of the Gantt chart

  • Identifies activity dependencies;
  • Visualize project schedule;
  • Shows milestones (the critical path);
  • Helps manage resource allocation;
  • Indicates deadlines for activities;
  • It helps break down the project into smaller, simpler tasks;
  • Monitor progress.

Cons of the Gantt chart

  • Its set-up can be complicated;
  • It can be confusing;
  • It does not state priorities;
  • It includes more details than necessary for some team members;
  • It requires time for adjustment;
  • It is not recommended for projects lacking a clear end goal.

What is a Kanban board?

A Kanban board is a visual tool for the project manager and team to manage and monitor workflow.

The Kanban method, which is derived from the Lean methodology, is commonly used in agile processes.

The principle behind Kanban involves focusing on completing tasks before starting new ones.

Kanban means “signboard” in Japanese, and from this, we can see why each activity is represented by a “card” that moves across the board as it progresses through the different stages of the workflow.

Columns on the board usually include stages such as “To Do,” “In Progress,” and “End.” One of the main benefits of using Kanban boards is their visual nature, which provides a quick and user-friendly way to understand the status of tasks and the overall workflow.

Team members can easily see which activities are ongoing, which have been completed, and which have yet to be started.

Just like Gantt charts are useful for some things and not as useful for others, so are Kanban boards.

Here are the pros and cons of this methodology:

Pros of Kanban board

  • Shows workflow;
  • Boosts productivity;
  • Reduces waste;
  • Promotes collaboration;
  • Provides flexibility;
  • Prevents activity overload;
  • User-friendly.

Cons of Kanban board

  • It is difficult to determine when tasks will be completed;
  • It can become too complex and inefficient;
  • Must be constantly updated;
  • Not suitable for projects with tight deadlines;
  • Requires process stability;
  • It does not show how long an activity has been on the board.

Gantt vs. Kanban: Which one should you use?

Kanban boards and Gantt charts are project management tools that visualize upcoming tasks, when they are to be completed, completion percentage, and, often, who is in charge of the tasks.

The main difference is that the Gantt chart shows the entire project on a visual timeline that also displays relationships between tasks. In contrast, the Kanban board focuses on the volume of work that needs to be done, is in progress, or is completed.

Therefore, the Gantt chart is better suited for planning since it can link dependencies and show the critical path, as well as resources, costs, and more. Kanban boards, on the other hand, are better for the team as it executes its tasks.

Team members can see what has been assigned and move it from one column to the next as they work on the task to completion.

Gantt vs Kanban: Why not use both with Twproject?

As this article has shown, the Gantt chart is better suited to a predictive approach, while the Kanban methodology is agile.

Nevertheless, you can use both, such as creating a Gantt chart for the project as a whole and applying the Kanban methodology to its subsets.

It might seem cumbersome to successfully integrate two tools during project management, but this and more becomes feasible thanks to project management software such as Twproject.

With Twproject, you can easily create Gantt charts and Kanban sheets and use other project visualizations.

This software is highly flexible and can adapt to any methodology.

Every company has its unique way of working, and Twproject was created to streamline processes while respecting the uniqueness of each reality.Gantt, Kanban, and more: Twproject cares about your success.

Still in doubt? Well, you can try yourself with a free demo.

Work Breakdown Structure vs. Gantt: a hands-on comparison

Work Breakdown Structure vs. Gantt? These are both powerful and critically important tools in the project management world.

Although these terms are sometimes used interchangeably, they are not synonymous and it is crucial to understand their purposes and area of use.

Let’s take a look at what they are and how they are used.

What is a Gantt chart?

A Gantt chart is a bar graph showing a project’s progress, time sequence, and dependencies.

This tool, developed more than a hundred years ago by Henry Gantt, has become one of the most widely used techniques for planning and monitoring projects.

A Gantt chart comprises horizontal bars (Gantt bars) representing project tasks.

Gantt bars show start and end dates, dependencies, schedules, and deadlines, including the portion of the task completed per phase and who is responsible for the work.

Beginners in the field create their first Gantt charts with some common programs such as Excel (learn more –  Gantt Chart with Excel: What are its limitations?)

Please remember that Excel was not designed for this purpose.

Yet, to take planning to a higher professional level, you must choose a full-featured project management software such as Twproject.

What is a Work Breakdown Structure?

A Work Breakdown Structure, or WBS, is a hierarchical breakdown of the project scope into smaller, more manageable components.

WBS can help define project scope, allocate resources, assign responsibilities, and estimate project duration and budget.

Project managers implement the WBS to break down large projects into smaller, more easily manageable steps to carry out tasks faster and more efficiently.

Breaking down the project into less complex parts improves team productivity and helps manage costs and contingencies.

Moreover, full WBS representation can support communication, increase transparency, and promote effective discussions.

There are many software solutions for creating a Work Breakdown Structure, and Twproject is one of the best options on the market.

WBS vs. Gantt: When should you use one or the other?

Typically, project managers apply the WBS to visualize what they are doing and the Gantt chart to illustrate when they are doing it.

More specifically and in practice, we can say:

WBS

  • Pros: WBS can help clarify the project goals, avoiding scope shifts and unnecessary changes. It can also break the project down into manageable parts, supporting the organization and prioritization of project work.
  • Cons: It can smooth communication and collaboration between the project team and stakeholders, aligning their expectations and requirements. It can also support risk management and quality control processes, helping identify and mitigate potential problems and errors.

Gantt chart

  • Pros: Gantt charts can benefit project management in many ways, such as providing a clear and visual overview of project planning, showing dependencies and constraints between project activities, highlighting critical paths and downtime, and improving communication and reporting on project status. It can also help monitor and measure project progress and performance, optimize resource allocation and activity sequencing, manage risks and problems, and keep stakeholders informed and engaged.

  • Cons: Gantt charts have some shortcomings. They can be difficult to display and interpret, particularly for multifaceted projects. Also, they can be inaccurate or misleading if they are not based on reliable data and assumptions and may not account for changes and variations in the project environment.

The Work Breakdown Structure vs. Gantt clash is always relevant and raises many questions since these are two core project management tools.

Both concepts provide project managers and their teams with information on progress.

They also boost efficiency and guide individuals to successful decisions.

The best choice would be to integrate both tools – the WBS divides the work hierarchically, from top to bottom. More specifically, it can be considered the skeleton of the future project plan.

The Gantt chart is linear and illustrates time progression from left to right. Once the necessary activities have been determined, dates, timelines, and dependencies are considered, and then a Gantt chart is developed for the start of work.

This is why modern PM tools such as Twproject include the option to create a Gantt chart within the Work Breakdown Structure feature.

WBS vs. Gantt: Twproject built-in tools

With Twproject, managers can accurately define each task’s finish date, ensuring that deadlines are always met.

This platform shows the start and finish of each task through a bar chart, making it easy to read and interpret the work plan. 

This visual aspect is critical for tracking project progress, providing a snapshot of progress and any critical issues.

Furthermore, Twproject is not limited to planning and monitoring; it is also a powerful tool for risk management.  

Through the detailed analysis provided by the WBS and the timeline representation of the Gantt chart, project managers can identify potential risks early and plan corrective or preventive actions to ensure project success.

Optimizing planning with WBS in Twproject

Using the Work Breakdown Structure in Twproject is the first step in breaking down a complex project into smaller, more manageable parts.

Project managers can begin by defining the main objective of their project and breaking it down into sub-projects and activities. This hierarchical approach makes it easier to understand the project’s overall scope but also helps identify the resources needed and distribute tasks effectively.

In Twproject, the WBS becomes interactive, enabling managers to add, edit, or rearrange tasks with simple drag-and-drop. This ensures that every element is in the right place and nothing gets overlooked.

Gantt timeline visualization in Twproject

After defining the project’s structure with the WBS, project managers can switch to Gantt timeline visualization in Twproject.

This tool turns the plan into a visual timeline, where each task is depicted by a bar indicating its duration, dependencies, and alignment with other tasks.

Twproject’s feature of showing real-time changes in the Gantt chart allows managers to quickly adjust the schedule in case of unexpected events, ensuring that their project stays on track. 

Therefore, Gantt visualization becomes central to monitoring project progress and ensuring that each phase proceeds according to plan.

With Twproject, project management becomes a more streamlined, controlled, and visually user-friendly process, converting every challenge into an opportunity for success.

Keep all your projects under control with Twproject!


Why the Gantt time schedule is crucial for projects

A timeline can be described as a chart that helps you understand the progress of a project in terms of activities on the Y axis and their duration on the X axis. We had already discussed Gantt in a different article, today we will try to explore other aspects of a timeline.

If the standard vertical to-do list doesn’t provide the necessary information to manage a project, the timeline may be the solution; it is an extremely useful tool in project planning.

Also, the option of having the Gantt timeline available in an automated manner can exponentially improve the workflow and its charting.

So let’s see in this article the importance of a timeline in a project management software.

How does the automated Gantt timeline help the project team?

The Gantt timeline is a tool that is used in two key phases of the project life cycle: planning and monitoring.

The most common project management actions performed using this tool are:

  • Visualizing the schedule
  • Allocating due dates to tasks
  • Allocating resources to activities
  • Identifying the critical path
  • Tracking work items progression

Some of the distinguishing elements that set project management software apart from a manual Gantt timeline include:

  • Color coding. To portray different attributes of the activity, such as who is responsible for its completion. For example: all of Maria’s activities are blue, all of Francesco’s activities are yellow, etc.
  • To display how much work of a given task has been completed. For example, a task that is 50% complete is half shaded.
  • Dependent activities. A software allows you to automatically cycle through the planning when changes are made to one of the dependent activities.
  • Drag-and-drop. This allows users to easily move a task to change the schedule, even automatically updating following tasks due dates.
  • Easily hide or show task details. Users can click or hover over a task to view its details, such as start date, expected end date, completion percentage, and who is in charge.

Now let’s see what additional benefits having the timeline in a project management software brings.

The Gantt timeline to manage complex information

Gantt timeline makes a project’s critical information easily manageable and accessible.

Users can learn at a glance:

  • Who on the team will accomplish the task
  • When the task will be completed
  • How that particular task relates to the project as a whole

To pass on this information, tasks are displayed as horizontal bars and are color-coded to represent the employee or department to which they are assigned.

The Gantt timeline to improve team productivityline in a project management

task assignments

Task assignments and progress information are displayed publicly in work progress Meetings, helping individuals to maintain control over their work and allowing team members to assume responsibility.

Once a project is underway, the Gantt timeline in Twproject, for istance, shows progress in several ways, including::

  • Activity will be shaded, thus reflecting the completion percentage.
  • Users can hover or click on a task to view extra details, such as “start and end date” and “duration.”
  • Also, some tools allow managers or administrators to schedule alerts via email or other messaging tools when a task is approaching its due date or if a task is in danger of not being completed on time, allowing corrective measures to be implemented.

Thus, by publicly tracking progress, the automated timeline can also be used as a motivational tool.

Progress tracking can be used to motivate teams to make an effort to achieve and complete the tasks for which they are accountable.

The Gantt timeline for more effective resource planning

The Gantt timeline allows the project manager to distribute work more effectively among resources due to current and future project schedules mapped to their respective timelines.

Needless to say, Gantt is not the only planning tool used, and many project management software includes resource management capabilities.

Yet, any software that includes a timeline offers additional insight into employee use and availability.

Twproject is a tool that has allowed us to plan projects in an excellent and transparent way, improving team efficiency and maximizing overall productivity

The Gantt timeline to centralise information

Centralizing project information through a timeline helps to keep different stakeholders in line, allowing them to easily share information and remain up-to-date.

This is a great way to summarize complex project data for a range of audiences, as users can choose to view only the information that is most important to them.

In fact, the Gantt timeline is compressible and expandable, allowing the user to select the appropriate level of detail.

This is particularly true when using cloud-based project management software that automatically updates and reflects any changes made in real time.

Because these solutions allow any user to log in at any time from any device, remote teams can thus be even more connected.

The Gantt timeline to make project and team requirements clear

The timeline helps employees to better understand their responsibilities and how their activities are tied to the overall project.

This also helps project managers and other stakeholders in determining project milestones.

The timeline basically is a sort of map that helps everyone involved in a project visualize how they will get from the beginning to the end result.

Start now with Twproject

The importance of Gantt charts cannot be denied once you become familiar with them, and with Twproject is so much easier.

Twproject allows you to draw the project wbs, add durations and dependencies between tree nodes, assign resources, until you have a complete Gantt of the project that will guide you throughout its entire life cycle:

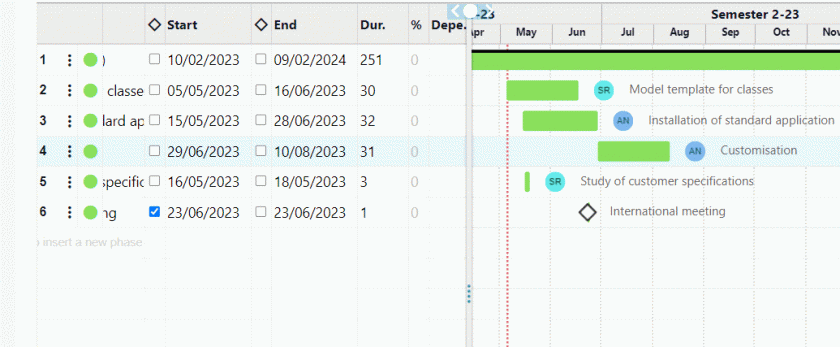
setting assignments in Gantt timeline

Discover Twproject’s Gantt timeline.

One try is worth a million words.
 

The best software for Gantt chart 2024

Do you want to quickly find out which are the best Gantt chart software in 2024? We have drawn up a special list for you.

The Gantt chart is the best tool to get an overview of project performance.

It allows you to have the start and end dates of the project and its phases, their duration, their correlation, the assignees, all in one view.

As we shall see, there are many reasons to implement it, but to draw up a Gantt chart that is really useful and effective, we need the right tools.

Otherwise, we risk wasting a lot of time creating a merely theoretical plan, which will soon be abandoned and remain only in the initial plans of the project leader.

In fact, the key words for evaluating a good Gantt chart are in our opinion: dynamicity and shareability.

Origins and qualities of the Gantt chart

The Gantt has undergone many evolutions over time. Initially, it was a simple, static, time chart for initial planning.

Until not so many years ago, the Gantt was a theoretical structure that was designed at the start of a project, then printed out and hung on a wall in the workplace.

It was a simple benchmark, but unfortunately after a few days or weeks, the chart already became obsolete.

With the emergence of calculation software and then later with web tools, the Gantt became an operational tool.

Its function today does not end at the planning stage, but continues during project execution.

And this is why it must necessarily be integrated and interoperable with other tools. Nowadays, the Gantt chart only makes sense if it is dynamic, sharable, updatable in real time.

Here are in detail the two aspects we took into account the most during our analysis in search of the best software for creating Gantt charts.

First quality of the best Gantt chart: dynamicity

By ‘dynamic’ we mean both the interactivity of the Gantt and its integration with other working tools.

In fact, a good Gantt chart must be able to evolve as various activities are completed. And of course, it is better if this evolution takes place in an automated way and in real time.

At the same time, the information that allows the Gantt to change and progress comes from other sources, such as worklog data, calendar and ToDos performed.

Conversely, the assignments distributed through the Gantt make up and update the 0perators’ workload; its duration affects budget estimates and many other aspects of project management.

This explains the relevance of the Gantt chart in a project management software: it is the starting point and the core to which everything leads back.

The tools we have included in our list of the best Gantt chart software possess this quality!

Second quality of the best Gantt chart: shareability

Together with the interactivity of the Gantt, the group of actors involved in the use of this chart has expanded.

We are talking about the actual project executors, but also about the stakeholders: each resource has its own specific reasons for keeping an eye on the Gantt.

Having a Gantt at hand when we are presenting a project and being able to act within it in real time during meetings is definitely a good practice.

This increases the involvement of the parties and helps achieve a holistic view.

In addition, the most advanced tools also have very customisable role permission systems that allow certain aspects of planning to be delegated.

For example, the project manager may need to entrust the planning of certain project sub-phases to other collaborators, and good software must in our opinion allow for this elasticity on permissions.

But let us finally come to our ranking of the best Gantt chart software, bearing in mind the aspects we have highlighted so far, and see who and how performs the work best.

Here is the list of the best Gantt chart software:

1. Twproject

Gantt Twproject - best gantt chart software

Let’s start with what is considered by many to be the best Gantt chart on the market: Twproject, a software that has made this chart its strong point.

Twproject was founded in 2001, but only from its fifth release did it integrate the Gantt among its tools.

Its team waited until they had the technological maturity to develop a tool that had real utility and was not equivalent to graphing on a spreadsheet.

Since then, however, Twproject has ensured that its Gantt chart became increasingly comprehensive and interoperable, always adding new optimisations and functionalities.

Twproject stands out by having a rather customisable and realistic Gantt that truly reflects the progress of projects.

The elasticity of Twproject’s Gantt is remarkable, but at the same time this tool is extremely precise and its interaction with the other elements of the software is total and accurate.

Last but not least, Twproject guarantees the possibility of keeping track of all previous changes made to the Gantt chart, thanks to the timeline: with this, you can scroll back in time and review the Gantt chart structure at any desired date.

Best features:

  • Overview or detailed view: possibility to have a lower or higher detail level and zoom in on individual phases of the WBS
  • Creation of phases and milestones: from list or drag and drop, as preferred
  • Assignment of phases: possibility to set assignees directly from the Gantt
  • Integration with workload: warning of overloads and reallocation with ‘magic wand’ tool
  • Critical path: possibility to check crucial nodes of project development
  • Timeline: user-activated project change history
  • Dependency types: in addition to the classic Finish to Start dependency, three more dependencies are available to better accommodate different work dynamics
  • Elasticity: possibility of having non-sequential dependencies
  • ToDo view: side-by-side and integrated ToDo management for each project phase
  • Role and permission management: possibility of assigning the planning of various phases to different users
  • Sharing: exportability in various formats

Pricing: from € 7.89 per user/month.

Pros: Twproject makes it possible to create a Gantt chart that is unrivalled in terms of user-friendliness, accuracy and variety of functions. Thanks to constant feedback from its users, this product is constantly evolving and improving.

Cons: Frankly, it is difficult to find a single negative aspect in Twproject’s Gantt.

With Twproject, you never have to enter information twice: everything is designed to optimise working time and offer a useful tool in daily operations

2. ClickUp

ClickUp - gantt chart software

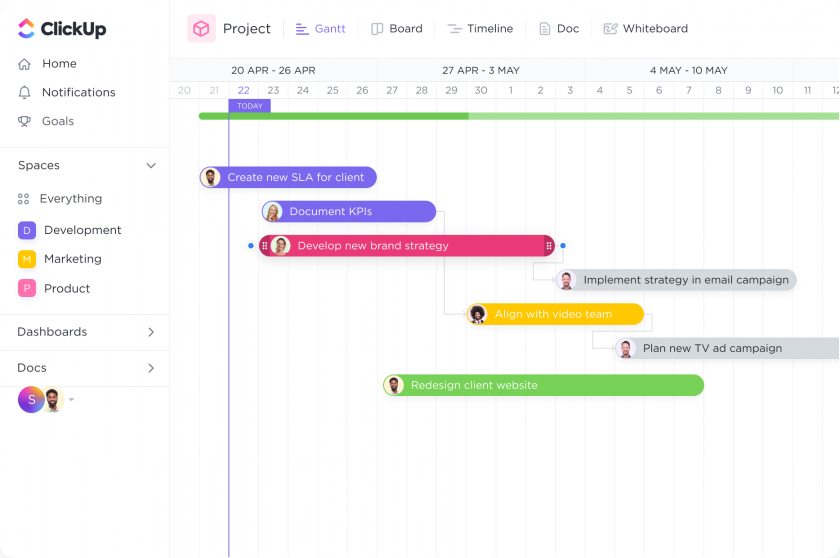
The Gantt that can be created with ClickUp has a good overview of the entire project, which is also highlighted by the green bar that encloses all project phases, showing the total duration at a glance.

On each step, the name of the assignee is clearly visible, but other information, such as the percentage of work done, is missing.

There is a general lack of connection with the resource load.

As there is no difference between activities and project phases in Clickup, the Gantt chart is very quick to create and manage.

However, this can be a disadvantage when it comes to complex projects or projects with many micro-tasks to perform and keep track of.

Best features:

  • Hierarchical structure: Spaces > Folders > Lists
  • Lists of tasks have their own Gantt
  • Tasks that can be entered directly on the gantt by dragging and dropping
  • Secondary opening of the related tab with various detailed information
  • Duplication possibility
  • Wide range of customisation possibilities

Pricing: from $ 7 per user/month.

Pros: ClickUp has an attractive interface, and its Gantt is no exception. It makes the agile philosophy its strong point.

Cons: It lacks some advanced features and at first glance its Gantt editor can appear a little chaotic.

Agility and aesthetics combine in a tool that is quick to use but not always complete in its functions

3. GanttPRO

Gantt PRO - gantt chart software

With almost diametrically opposite characteristics we find Gantt PRO.

As its name suggests, it is a software totally dedicated to the Gantt chart.

Project planning starts precisely from the Gantt view, with a WBS side-by-side, in which projects and task lists are entered.

Alongside the Gantt, there are also secondary views, such as the Kanban board, operator loading and reporting.

Some secondary functions such as budgeting and time tracking are only available in advanced licences.

Best features:

  • Fixed hierarchy of projects and task lists
  • Various baselines can be created
  • Percentage turnaround that can be set directly on the task by dragging and dropping
  • Dependencies with Finish to Start or Start to Start type
  • Gap between dependencies settable in hours
  • Critical path

Pricing: from $ 9.99 per user/month.

Pros: It turns out to be a good technical product, with a simple, clean interface and few but clear functions.

Cons: It has a somewhat dated appearance and is little or no customisation. Some secondary functions such as budgeting and time tracking are only available in advanced licences.

If the objective is to create accurate Gantt charts, it may be a solution, although lacking in interoperability with other management tools

4. Smartsheet

Smartsheet - gantt chart software

It is a software that plans to replace Excel spreadsheets for business management, and thus closely replicates its functionalities.

Smartsheet is a tool consisting of many combined elements, with the addition of typical project management tools.

The data entered in your worksheet can then be interpreted through the various views, including the Gantt view.

It is therefore a tool that requires good expertise in the use of calculation formulas.

Best features:

  • Customising phase colours
  • Conditional formatting allowing the setting of customised rules for the display of phases
  • 4 zoom levels: quarter – month – week – day
  • Secondary views: list, calendar and board
  • Critical path
  • Percentage of work done shown on phase
  • Task duration: shown only when dependencies are activated

Pricing: from $ 6 per user/month, for up to 10 users.

Pros: The main feature of Smartsheet is the possibility of customisation, both graphically and in terms of the method used.

Cons: Lack of automation and the need to master the calculation formulae for its use.

Technical tool with refined functionality, but not exactly useful for saving time in planning

5. Toggl Plan

Toggl Plan

Toggl strongly focuses on the human resources aspects of the projects.

It is therefore very much geared towards managing tasks and assignments in a smooth manner, particularly through its Gantt editor, but not only.

The special feature of the tool is that it allows you to create resource-specific, as well as project-specific, Gantt charts.

It could therefore be useful for those who specifically deal with scheduling and balancing the working time of human resources in a company.

Best features:

  • Data sharing to external users also
  • Estimated vs. actual progress
  • Good integration with resource load, which is visible at the same time
  • 4 zoom levels
  • Drag and drop for duration and dependencies
  • Colour customisation of assignments

Pricing: from $ 9 per user/month.

Pros: In general, it is easy to use and has a modern, user-friendly interface.

Cons: Perhaps also because of its easiness, it has some limitations, especially when it comes to integration with other views of the software.

Agile and easy-to-learn software, more useful if the work is set up in a resource-oriented manner

6. Team Gantt

Team Gantt

Here again we are in front of a tool that starts projects directly from the Gantt.

Only at a later stage, one can add tasks and distribute assignments.

Almost all of its functionalities relate to the Gantt chart and many interactions can be done directly from this view.

A limitation is the fact that tasks and ToDos are not distinct from each other. In addition, all tasks related to a project are always visible on the Gantt, making the management of complex projects somewhat difficult.

Best features:

  • Ability to add notes and attachments to tasks
  • Possibility to enter the percentage of task completion
  • Workload view openable from Gantt
  • Total view of the number of tasks assigned per person in days or hours
  • Health report
  • Secondary views: list, calendar and board

Pricing: from $ 8 per user/month.

Pros: A detailed and very specific tool for creating Gantt charts, with some useful customisations.

Cons: Among the customisations, the differences between dependencies and their elasticity unfortunately do not appear. Furthermore, due to an excessive level of detail by default, the Gantt loses its primary function as a comprehensive overview tool.

Suitable for those who need to create many Gantt charts for small projects but somewhat lacking in cases of complexity

Bottom line

We have tried to help you choose the best Gantt chart software for your projects.

In conclusion, keep in mind that if you decide to try to Twproject:

  • its interaction with ToDo lists makes it possible to overcome the classic Waterfall vs. Agile opposition, and creates a new structured yet dynamic approach.
  • The possibility of having a timeline that allows you to go back to the planned structure at any time, right from the start of the project, makes Twproject’s Gantt chart the best planning tool. In fact, it allows us not to miss any important data and to be able to reschedule freely and without delay during project implementation.

If you wish, you can tell us if this analysis was useful to you and start creating a Gantt chart in the best possible way right away: with Twproject you can try it out for free for the first 15 days.

Gantt vs. Pert: two tools in comparison

Gantt vs. Pert are two of many different project management planning tools available.

They aim to help project managers accomplish their work better by facilitating activity coordination and stakeholder communication.

These diagrams help manage the challenging constraints of time, cost, and scope, which are the predominant forces in any project.

Let’s look at the comparison of the Gantt vs. Pert tools in detail.

What is a Gantt?

A Gantt chart is one of the most popular ways to show activities by time, as it is a core project management tool for planning and scheduling (learn more at How to make a Gantt chart).

Specifically, it consists of two axes:

  • A vertical one consists of a list of activities that must be accomplished to complete the project.
  • A horizontal one represents the timeline of a plan, in which the bars are the activities set in chronological order.

This system allows all stakeholders to be provided with the same information and shared expectations.

Plus, the Gantt chart, thanks to its graphic time sequence, clearly shows how activities are related to each other, making it one of the best visualization tools in project management.

The clarity with which a Gantt displays this information helps considerably with management and communication within the project team.

When is it appropriate to use a Gantt chart?

The Gantt chart is arguably the most flexible project management tool available: not only is it used during the planning phase of the project, but it is also useful throughout the execution phase to monitor progress.

Therefore, project managers use Gantt charts to get an overview of the project at any given time, create and assign tasks, monitor their budget, manage resources, and much more.

With this tool, you can ensure everyone can access any schedule and project details in real-time.

Gantt can be used in many scenarios, but it is particularly beneficial when:

  • Project activities are well-defined and neatly arranged. A Gantt chart is great for visualizing a series of activities in a precise sequence. However, if activities are still loose or the order is unclear, this chart may not be very helpful.
  • The project has a set duration: The Gantt chart is useful for monitoring progress over time and identifying any delays. The diagram may not be the best option if the project duration is uncertain.
  • The project is small or medium-sized: Gantt charts are easier to manage for projects involving a limited number of tasks. For very complex projects, they may be difficult to interpret and keep up to date.
  • You need to communicate your project plan to a team or client: The Gantt provides a user-friendly visual representation of the project, making it easy for all stakeholders to understand.

Besides these cases, the Gantt chart can also be useful for:

  • Manage project resources;
  • Identify dependencies between activities;
  • Estimate project duration;
  • Monitor project costs.

What is a PERT chart?

PERT stands for “Program Evaluation Review Technique” and is a project management tool that visually represents activities and dependencies of a project.

In this chart, we use arrows to show the activities required to meet a given event, symbolized by a node. As a result, a node represents a completed phase of the project.

Therefore, a PERT chart looks like a network diagram, where each separate box (or node) represents a project activity. Arrows show the dependencies between activities, connecting them.

When should you use a PERT chart?

A PERT chart provides a visualization of the entire project timeline in a chart that is easy for team members and project stakeholders to understand.

Moreover, the PERT chart allows project managers to learn and keep track of important workflow information: task dependencies, estimated task time, and minimum project delivery time.

Therefore, it is mainly suitable for all projects except small ones, where checklists are good enough to get the big picture.

PERT can make the workflow smoother when:

  • The plan involves multiple activities running simultaneously: In this case, the diagram will make the prioritization process easier, helping to understand which activity depends on another.
  • The project has a strict time frame: A PERT chart is not only a visual representation of a project’s structure but also helps gauge its duration. This tool allows you to set deadlines and stick to them.

Here are some cases where you should use a PERT chart:

  • Projects with many unknowns: The PERT chart is particularly suitable for managing projects with many variables and uncertainties, where the exact duration of activities is difficult to estimate.
  • Projects with many interdependent activities: If project activities are interdependent and the delay of one may affect the others, the PERT chart helps to map out the critical path and manage any potential issues.
  • Long-term projects: It helps estimate the duration of long-duration projects, which are spread over several months or years.
  • Projects with limited budgets: PERT can help optimize resource utilization and reduce project costs.

Besides these cases, the PERT chart can also be useful for:

  • Identify project risks;
  • Evaluate different project alternatives;
  • Communicate the project plan to a team or client.

Gantt vs. Pert: two tools in comparison

Gantt and Pert charts offer unique approaches to planning, executing and monitoring projects, each with strengths and ideal applications.

Twproject integrates both of these tools, empowering teams to choose the approach that best suits their needs.

Twproject’s Gantt, which is a bar chart, provides a visual representation of project progress by showing activities as horizontal bars running along a project timeline.

This user-friendly layout provides project managers and team members with a convenient way to see the sequence of activities, their durations, overlaps, and time dependencies at a glance. 

It is particularly useful for projects with a clear, sequential structure, where planning and time tracking are crucial.

Let’s take a look at the pros of the Gantt chart:

  • Immediate visualization: It provides a clear and straightforward overview of the project’s progress.
  • Resource monitoring: It helps to assign and monitor resources, displaying who is working on what and when.
  • Deadline management: It helps to identify and manage deadlines, making it easier to adjust plans according to changes.

Twproject’s PERT chart, on the other hand, focuses on analyzing and planning activities based on their interdependencies.

It uses nodes to represent activities or events and arrows to show precedence relationships between them. This approach is especially useful in complex projects, where finding the critical path and understanding dependencies between activities are critical to project success.

Let’s take a look at the pros of the PERT chart:

  • Critical path analysis: Identifies critical activities that cannot be delayed without affecting the project deadline.
  • Time optimization: It helps optimize project plans, allowing better allocation of time and resources.
  • Risk management: It provides a foundation for risk analysis, allowing potential snags to be predicted and mitigated.

In short, we have seen that both Gantt and PERT charts are visual tools for organizing activities during project planning.

The choice between Gantt and PERT depends on your unique project needs.

The PERT chart is great as it clearly shows dependencies between activities and the critical path.

This means that a project manager can make better decisions by managing data and performing what-if analysis.

The downside is that it is difficult to scale a PERT chart, and this can be an issue when working on more complex projects. The larger the project, the more complex the PERT chart will be and the more difficult it will be to interpret.

A Gantt chart allows a project’s time sequence to be displayed in a more structured fashion. It also allows work progress to be clearly visualized in real-time.

Therefore, a good project manager typically uses both techniques to fulfill multiple purposes.

Plan your projects with Twproject


How to make a Gantt chart

How to make a Gantt chart” is the starting point for all those who want to organize their workflow effectively.

A Gantt chart is a key tool for project planning and tracking. But how can you make an effective Gantt?

This article will explore the basic steps to create a simple and effective Gantt chart.

What is a Gantt Chart?

Before delving into the “how,” it is necessary to understand the “what.”

A Gantt chart is a visualization tool that allows project managers to map a project’s path from start to finish effectively.

Developed in the early 20th century by the mechanical engineer Henry Gantt, this tool has since evolved into one of the staples of modern project management.

Specifically, it is a type of bar chart that illustrates a project’s schedule, showing the different activities to be carried out on the vertical side and the expected timeframe for each of them on the horizontal axis.

Each bar in the chart stands for a specific activity in a project, with the length of the bar representing the expected duration for completion of the activity.

What makes the Gantt chart so precious is its ability to provide, at a glance, a detailed overview of how and when the various activities overlap, allowing project managers to optimize resources and better manage time.

Why use Gantt for your project workflow

Adopting a Gantt chart in your project workflow is recommended and a real winning strategy for any project manager.

This tool provides a straightforward view of each project phase, from each task’s start and end dates to the overlap between tasks and their duration.

But why is it so critical to the workflow’s success?

First of all, Gantt makes project management more accessible by allowing the selection of relevant data with precision and the visualization of the time axis format in a user-friendly manner.

This helps to immediately understand the sequence of activities and their interdependencies, improving planning and resource allocation.

Furthermore, visualizing distances between bars and stacked bars makes optimizing the time-space and preventing work overload possible.

Using a Gantt chart also supports selecting the most suitable format to visually represent the project, allowing you to include legend items and organize categories in reverse order, if necessary. This flexibility results in a better comprehension of the workflow by the entire team, streamlining communication and collaborative efficiency.


How to make a Gantt chart

Creating and using a Gantt chart are key steps in project management, providing a visual snapshot of a workflow.

Here are some guidelines for creating a Gantt chart:

1. Identify activities

The first step in creating a Gantt chart is establishing all the tasks required to complete your project. This includes large and small tasks, from the obvious ones to those that could easily be disregarded. Each task must be listed to be clearly displayed in the diagram.

2. Define dependencies

After having listed your tasks, the next step is to set the dependency relationships between them. This involves determining which activities must be completed before others can begin. This step is critical for creating a logical workflow and avoiding bottlenecks along the process.

3. Assign durations

Each task included in your Gantt chart must be given an assigned duration.

This not only includes the time required to complete the task itself but must also consider any dependencies that might affect its start or completion. The duration may be estimated in days, weeks, or months, depending on the scale of your project.

4. Calendar development

With the activities, dependencies, and durations in place, the next step is to develop your project schedule. This involves assigning specific start and end dates for each task, with consideration of dependencies and available resources. The schedule must be realistic and flexible, accommodating any changes.

5. Use the right tool to make your Gantt chart

Using a dedicated project management tool, such as Twproject, can considerably streamline this process. This tool has advanced features, such as easily updating tasks and their dependencies, checking real-time progress, and collaborating with team members.

6. Monitoring and updates

After creating your Gantt chart, your work is not over yet.

This chart must be regularly updated and monitored to reflect the progress of the project and any changes in the plan. This helps keep the project on track and pinpoint any delays or problems at an early stage.

But that is not all. The Gantt chart should be shared with your entire project team. This ensures everyone knows deadlines, priorities, and the overall workflow. Effective communication is crucial to the success of any project.

Make a Gantt chart with Twproject: the ultimate solution for effective charting

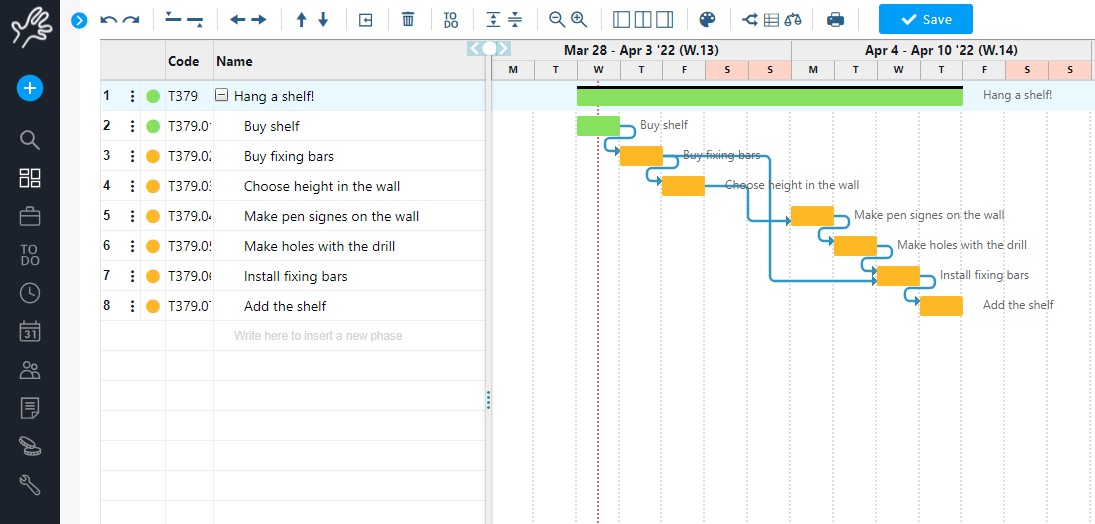
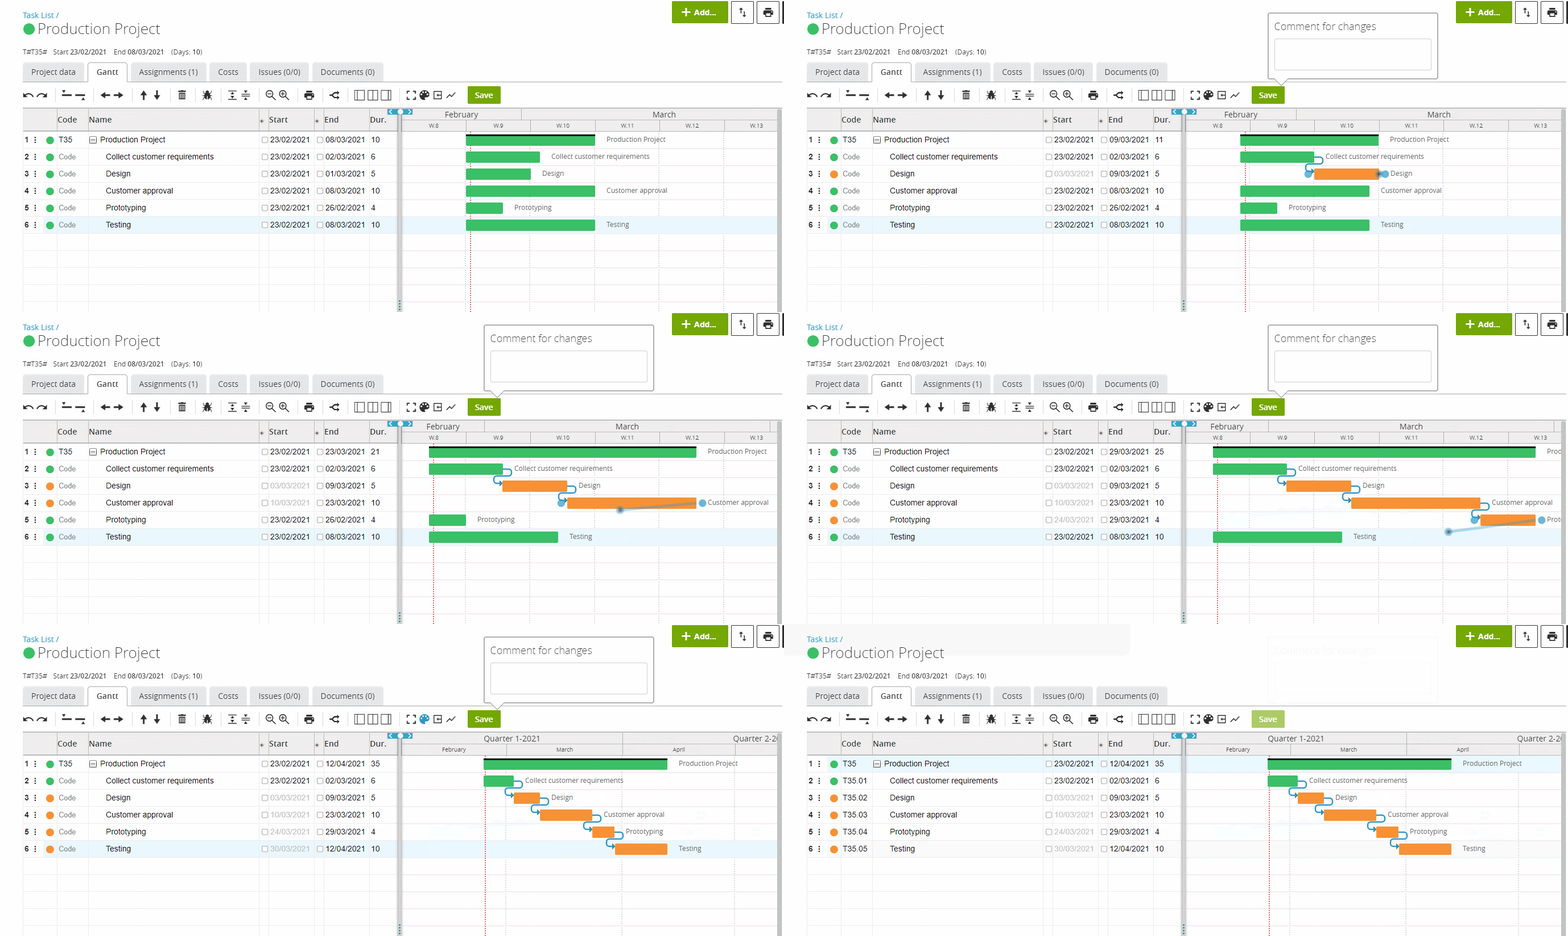
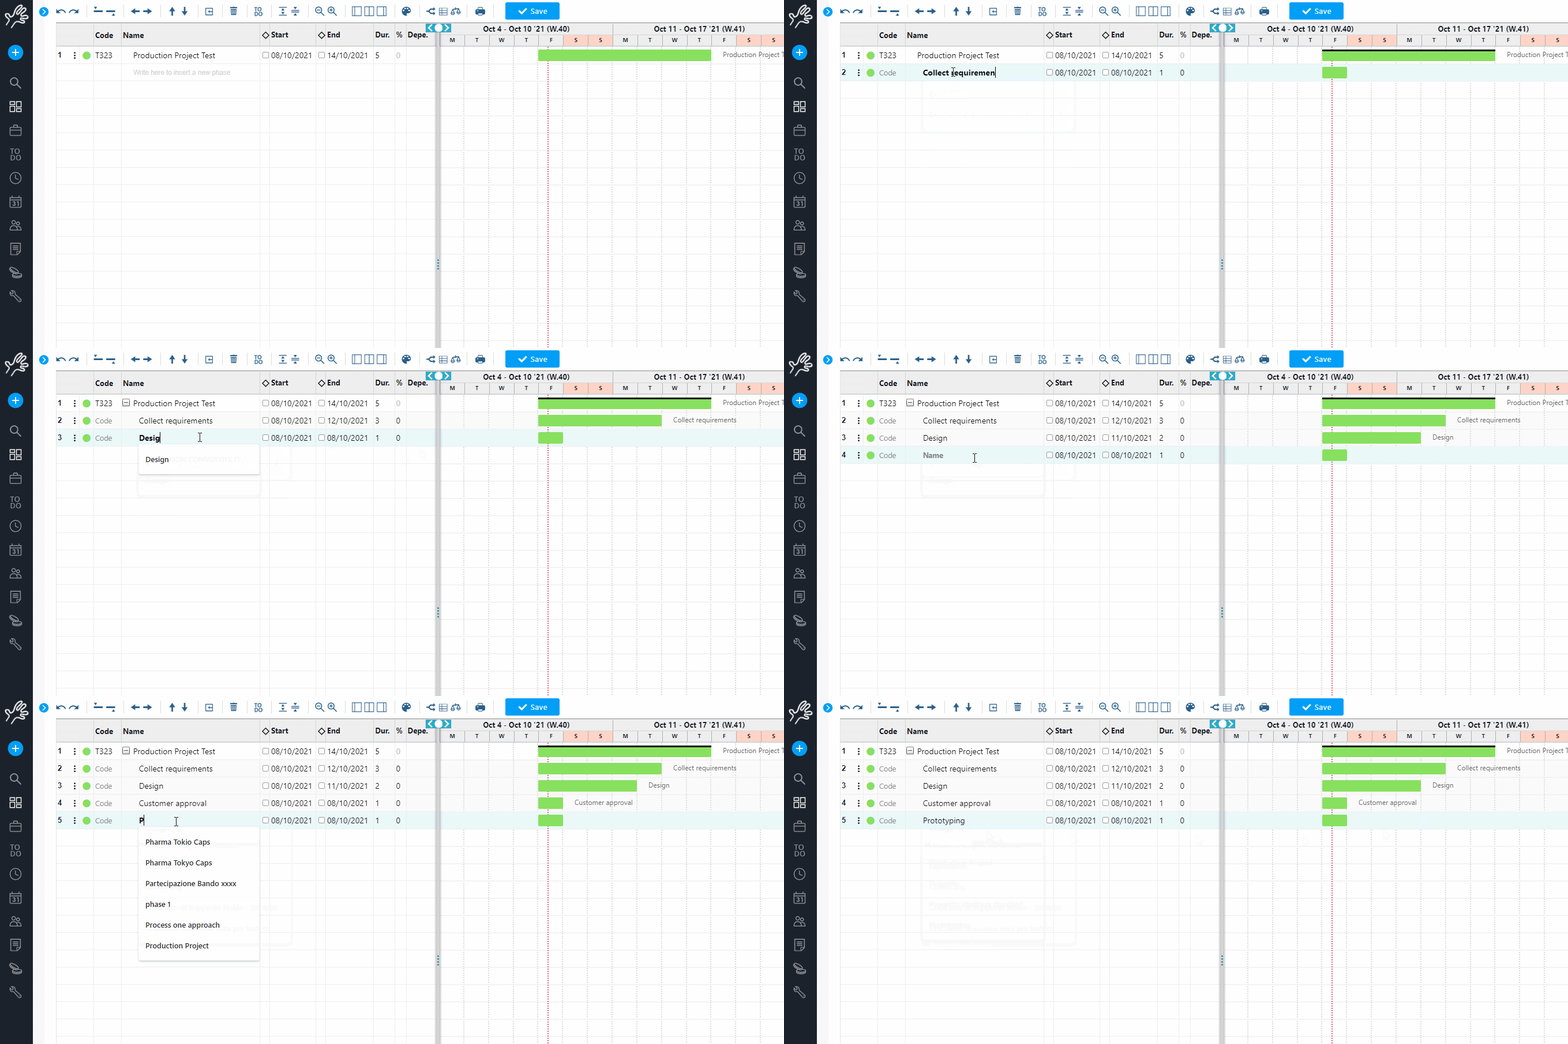
Twproject offers a user-friendly graphical editor for creating Gantt charts, which can be accessed by clicking the button at the beginning of the WBS.

editor gantt twproject

Those familiar with MS-Project will appreciate Twproject’s editor’s user-friendliness while noting significant differences in data models and usage dynamics.

Twproject’s main objective is to track work progress in real-time and adapt to dynamic and changing situations. This feature differs significantly from traditional project management, which involves detailed and advanced project definitions, often unrealistic in many work contexts.

Twproject adopts a distinctive model for organizing the project tree, deadlines, and statuses, diverging from the traditional Gantt chart. Projects can remain active beyond their scheduled deadlines or be temporarily suspended, thereby reflecting a more flexible schedule and dependency management.

Upon accessing your Gantt editor, you will find the WBS node you are exploring. The changes you make will only take effect once you press the “Save” button, allowing you to experiment with your project structure without altering its original configuration.

Grid panel

The project tree interface is structured in two main sections, divided by a movable vertical line. This divider can be moved to the right or left to suit your work area better. The section on the left includes the text panel.

Twproject gantt software

You can expand columns by dragging them and directly edit details such as code, name, dates, and dependencies by simply clicking on specific fields.

The project layout can be compressed; the system will save this visualization choice. You can also change project statuses via the status indicator.

gantt twproject software

Having established the dependency between the two phases, you can change the default Finish to Start (FS) relationship, opting for a different type of connection.

Twproject dipendenze gantt

Moreover, Twproject allows that interconnected activities do not necessarily have to follow one another sequentially but can overlap or be spread apart while still following the chosen dependency logic.

This flexibility improves compliance with project reality and reinforces the concept of delegation.

Elastic dependencies offer project managers the option of managing project phase schedules with greater freedom, without changes in one phase automatically leading to shifts in subsequent stages, thus promoting a more dynamic and customized approach to project planning and execution.

Gantt Panel

On the right-hand side of the interface, which graphically represents your project timeline, you can move the different phases of your project temporally by dragging and dropping them, changing all dependencies accordingly, where feasible.

Positioning your pointer at the beginning or end of a project or phase will turn into a bi-directional arrow, allowing you to extend or reduce the duration of the relevant project or phase. Again, the associated dependencies will be adjusted, always within the constraints set by the project.

Actions performed within the panel are bound by the limits and restrictions of the project and will only be allowed if they do not meet these constraints. For example, you cannot move a milestone if it has already been defined.

Using the Gantt panel, you can also set up new dependencies between project phases by dragging dependency markers to other phases and changing the associated states accordingly.

To create child tasks, all you have to do is write their name in the ‘name’ column.

gantt chart twproject

Then, you can set the start and duration by dragging the bar from the graphic part or manually writing dates in your columns.

Recently, we introduced a new feature that integrates ToDo lists with the Gantt chart to make it easier to manage project meetings (learn more here).

This new feature allows the planned activities in the Gantt chart and the details of the ToDo lists to be displayed simultaneously, making it easier to understand the progress of the project and the individual tasks to be completed.

Watch our tutorial to learn how to make an effective Gantt chart step by step:

Making a Gantt chart means having in-depth control over each task and its start and end dates and being able to plan precisely, anticipate risks, and manage resources efficiently.

Whether managing small projects or orchestrating large initiatives, the Gantt chart remains an indispensable ally for anyone who wants to complete their projects efficiently.

Still in doubt? Well, you can try yourself with a free demo.

Gantt: what it is and why it is key for projects

Why create a Gantt Chart? What is it and why is it important in projects?

If you are starting to immerse yourself in the world of project management, then you should familiarize yourself with this essential tool in this industry.

Its importance in the context of project management lies in its capability to help you organize activities logically and sequentially, identify dependencies between activities, allocate resources effectively, and keep track of overall project progress.

In this article, we will explore together what a Gantt chart is, why you should use it, and how Twproject can revolutionize your approach to project management.

Gantt Diagram: what is it?

The Gantt chart, which bears the name of its inventor, Henry Gantt, is a visual tool used in project management to portray activity planning over time.

This tool appears as a horizontal bar chart, where each bar stands for a specific project activity, its duration, as well as its planned start and end.

The key to the success of a Gantt chart lies in its power to provide an at-a-glance overview of the project’s progress, allowing project managers and team members to understand deadlines, dependencies between activities, and resource allocation easily.

It also facilitates the identification of potential schedule delays or conflicts, allowing real-time changes to be made to keep the project on track.

Thanks to its simplicity and effectiveness, the Gantt chart has become an indispensable tool for managing projects of any size and complexity, promoting clear communication and improving team efficiency.

Key elements of a Gantt chart

Gantt, with its user-friendly visual structure, comprises several key elements that make it easy to read and interpret. These elements are central to understanding at a glance the progress of a project, its timelines, and the relationships between the various activities.

Here are the key elements of a Gantt chart:

1. Horizontal bars

Horizontal bars are the most distinguishing element of a Gantt chart. Each bar represents a specific activity in the project, with the length of the bar expressing the duration of said task. The position of the bar along the time axis shows the expected start and end of that task.

2. Time axis

The upper or lower horizontal axis of the diagram shows the total time frame of the project, which is divided into time units (days, weeks, months). This axis makes it possible to visualize when activities should begin and end, providing an overview of the project timeline.

3. Activity list

On the left-hand side of the diagram, there is a list of all activities planned in the project. These are usually arranged in sequential or logical order and can be grouped by phases or work areas, making it easier to understand the structure of the project.

4. Milestones

Milestones are visual indicators, often represented by symbols, that mark critical points or significant objectives within the project. They have no duration but mark key moments such as the completion of a critical stage or the delivery of a deliverable.

5. Dependencies between activities

Dependencies show relationships between activities, indicating how the completion of one activity influences the start or completion of another. These are often expressed by arrows or lines connecting the bars, highlighting the logical sequence of activities and their interdependencies.

6. Activity progress

Some Gantt charts provide a visual representation of task progress, with partially filled-in bars to indicate how much of the task has been completed. This makes it easy to compare the actual progress with the original planning.

7. Allocated resources

In more detailed versions of the diagram, it may also be specified who is ultimately responsible for each activity or what resources have been allocated. This element helps to manage human and material resources better, ensuring that each activity has the necessary resources to be completed.

8. Colours and codes

Using different colors or codes can help to quickly differentiate between different activity categories, project phases, or priority levels. This design element further increases the diagram’s readability, allowing an immediate understanding of the project status.

These key elements make the Gantt chart an extremely powerful tool for planning and monitoring projects, providing a clear and understandable view of progress and facilitating resource and time management.

Why use the Gantt Chart in project management

After having shed some light on what a Gantt is and what it is about, let’s take a look at its benefits.

Using a Gantt chart in project management is not just a matter of convention or convenience – it is a strategic choice that brings with it many significant advantages. This tool proves to be vital in tackling the complex challenges of modern project management, thanks to its ability to simplify the planning and monitoring of activities. Now let’s take a look at why the Gantt chart is so valuable:

  • Clarity and immediate grasp: The first and arguably most apparent advantage of the Gantt chart is its visual clarity. The graphical portrayal of activities on a time scale makes the duration of each activity, overlaps, dependencies, and margins for flexibility immediately obvious. This helps all team members to quickly understand how their work fits into the larger project context, facilitating planning and self-organization.
gantt chart twproject

  • Better internal communication: The transparency offered by the Gantt chart improves communication within the team significantly. Each member can visualize not only their own activities but also how these relate to the work of others. This promotes a sense of collective responsibility for the project and helps to prevent misunderstandings or overlooking deadlines and priorities.
  • Time management optimization: By visualizing durations and dependencies between activities, Gantt charts help project managers optimize resource allocation and time planning. By pre-emptively identifying potential conflicts or overload periods in advance, it is possible to redistribute resources or revise deadlines to keep the project on schedule.
  • Facilitazione della pianificazione e del monitoraggio: Gantt chart is not only a planning tool but also a monitoring tool. It makes it easy to compare the actual progress of the project with the original planning, highlighting any delays or deviations. This is crucial for taking timely corrective action and ensuring that the project stays on track.
  • Decision support: when facing uncertainty or needing to make quick decisions, the Gantt chart provides a robust basis of objective information. Visibility into how various activities affect each other helps managers assess the consequences of any changes, supporting informed and strategic decision-making.
  • Versatility and adaptability: The Gantt chart is fit for projects of all sizes and industries. Its versatility makes it a precious tool for project managers working in diverse contexts, always offering a solid support structure for project management.

Gantt Chart: Which software to choose?

Beginners often resort to Excel for project management, mainly because it is familiar and seemingly simple. However, this choice can prove counterproductive.

Despite being a powerful tool for data processing, Excel is not optimized for project management and presents several limitations that can compromise effective project planning and monitoring (learn more here).

Evaluating project management software is a pivotal process to ensure that the chosen tool aligns effectively with the needs of the team and the project.

Twproject stands out as the best software on the market for creating Gantt charts for several key reasons that meet the needs of project managers.

These aspects make it well suited for those seeking not only to plan activities effectively but also to monitor project progress in real time, manage resources efficiently, and facilitate collaboration between team members.

Here’s why Twproject is the right choice:

1. User-friendly and customizable interface

Twproject offers a user-friendly interface that makes it easy to create and manage Gantt charts.

Users can easily add, edit, and arrange tasks, sub-projects, and milestones with just a few clicks. Advanced customization allows the Gantt to be adapted to the specific needs of the project, improving readability and understanding of the project status by all team members.

2. Advanced dependency management

Unlike other tools that offer limited functionality, Twproject makes detailed management of dependencies between activities possible.

This includes the option of defining complex relationships, such as flexible dependencies, which better reflect the dynamic nature of modern projects, allowing for more realistic and flexible planning.

3. Real-time collaboration

Twproject simplifies collaboration between team members by providing them access to the Gantt chart, viewing assignments, updating task status, and sharing documents in a centralized environment.

This considerably improves communication within the team and with stakeholders, reducing the risk of misunderstandings and accelerating the decision-making process.

4. Monitoring and reporting

Managers enjoy powerful tools for monitoring project progress and generating detailed reports. This way, they have a clear picture of the project’s progress, identify any delays or problems at an early stage, and make informed decisions to keep the project on track.

5. Efficient resource management

In resource management, Twproject offers powerful functionalities for allocating and monitoring human, financial, and material resources. Users can easily overview resource availability, prevent overloads, and optimize resource allocation to maximize project efficiency.

6. Scalability

Twproject is designed to fit projects of all sizes and complexities, making it a scalable solution that can grow with your business. No matter whether managing a single project or coordinating a portfolio of multiple projects, Twproject offers the functionality and flexibility to manage projects in different scenarios effectively.

Making a Gantt chart with Twproject is an easy and intuitive process, so you can focus on what matters: successfully completing your project.

Remember, the key for a project manager is not only knowing the right tools but also knowing how to use them at the right time.

Twproject is here to guide you through every step of your journey, making project management a smooth and rewarding experience.

Plan your projects with Twproject

Gantt vs Agile: differences and combinations

Gantt vs Agile? Choosing between tools and methodologies in project management can significantly impact your project’s outcome.

Understanding the peculiarities of a planning tool such as Gantt and a dynamic methodology such as Agile is critical for project managers who strive to optimize processes and lead their work teams to success.

We will examine their differences, benefits, and potential combinations for effective project management.

Gantt vs Agile: key differences

The distinction between the Gantt chart and Agile is fundamentally rooted in their nature – the  Gantt chart is a visual tool for planning and monitoring project phases, visualizing the length and sequence of activities on a time axis.

Conversely, Agile provides a flexible and iterative methodology designed to adapt to quick changes and promote continuous feedback between development teams and customers.

This core difference strongly impacts how project managers approach the structuring, execution, and adaptation of their projects.

The choice between Gantt and Agile and the decision to integrate them depends on the nature of the given project, the work environment, customer requirements, and team culture. Understanding these key differences is pivotal for project managers who seek to implement the most effective strategy for managing their projects.

Let’s take a look at their key differences:

1. Approach to planning:

  • Gantt chart: It is based on detailed and sequential project planning. Activities are presented as colored bars on a chart, with clearly defined start and end dates. This approach provides a clear picture of the project and makes it easier to monitor progress; however, it can be inflexible and unsuitable for projects with variable requirements or in uncertain contexts.
  • Agile: It is based on an iterative and incremental approach. The project is broken down into short cycles (sprints) lasting 1-4 weeks; a working version of the product is released at the end. This approach promotes flexibility and adaptability to change, making it ideal for projects involving uncertain settings or requirements that may evolve over time.

2. Team involvement:

  • Gantt chart: The team’s involvement in the planning phase may be limited. The Gantt chart is often created by the project manager or a planning team, and the development team may only play a minor role in defining activities and timelines.
  • Agile: The Agile methodology focuses on team involvement and collaboration. The development team is actively involved in sprint planning, task estimation, and decision-making. This approach supports the empowerment and motivation of the team.

3. Change management:

  • Gantt chart: The Gantt chart is a strict tool that is not well-suited for frequent changes. Changing a single activity can have a chain effect on the whole project, requiring an update of the diagram and timetable.
  • Agile: Agile methodology is designed to manage change flexibly. The sprint structure allows the project schedule to be revised and adapted frequently, incorporating feedback received and any changes in requirements.

Gantt vs Agile: pros and cons

Gantt and Agile offer distinct approaches to project planning, execution, and control, and each has its unique strengths.

Exploring both advantages can help project managers choose the best approach for their unique project needs, balancing detailed planning with the ability to adapt quickly to evolving challenges.

Pros of the Gantt chart:

  • Detailed and accurate planning: Gantt provides a visual portrayal of the project plan, illustrating the duration, start, and end of each activity on a time axis. This way, project managers can plan in detail and easily understand the dependencies between different activities, ensuring that all teams are aware of the different activities.
  • Progress monitoring: Project managers can easily monitor progress compared to the original plan, quickly spotting any delays or deviations from the schedule.
  • Deadline orientation: The Gantt diagram is especially useful in projects with well-defined objectives and deadlines, where the sequence and duration of activities are clear from the get-go.
gantt chart dependences

Pros of the Agile methodology:

  • Short iterations and constant feedback: Agile is based on short development cycles, known as sprints, which make it possible to adapt quickly to changes and to incorporate feedback from customers or end users constantly.
  • Better risk management: It helps to recognize and mitigate potential problems in advance.
  • Collaboration and communication: The agile methodology emphasizes collaboration among team members and with customers, promoting open and frequent communication.
  • Adaptability to change: Unlike Gantt, Agile allows for changes even at the late stages of a project, making it ideal for projects in dynamic and rapidly changing environments where requirements may change over time.

Is it possible to combine Gantt and Agile?

Integrating Gantt and Agile in a hybrid approach to project management offers many benefits to project managers, allowing them to leverage both qualities to drive teams to success in an increasingly complex and dynamic working environment.

1. Strategic planning and operational flexibility

The combination of Gantt and Agile allows managers to set a thorough strategic plan, thanks to the Gantt chart’s visibility on project phases and milestones.

Likewise, implementing Agile principles ensures the operational flexibility needed to adapt to changes, enabling the team to respond proactively to project and market needs. This balance between planning and adaptability is critical in complex projects where conditions can change rapidly.

2. Progress monitoring and quick iterations

The hybrid approach makes it easy to monitor project progress effectively, combining the straightforwardness of Gantt’s linear progress with Agile’s ability to implement changes quickly through fast iterations.

Project managers can, therefore, assess project progress concerning the original plan while preserving the flexibility to make corrections or adjustments based on feedback received during sprints.

3. Better communication and customer involvement

By integrating Gantt and Agile, project managers promote better communication within their teams and with customers.

Whereas Gantt provides a clear and understandable roadmap for all stakeholders, Agile supports continuous customer involvement, ensuring the final product is as close to expectations as possible.

This hybrid approach ensures that decisions are made with a full understanding of the project context, improving customer satisfaction and team effectiveness.

4. Resource optimization and efficiency

The combination of Gantt and Agile helps project managers optimize resource use, assigning tasks and priorities more effectively.

Thanks to Gantt’s in-depth planning and Agile’s flexibility, workloads can be balanced, resources can be allocated according to the evolving needs of the project, and waste can be reduced, increasing the team’s overall efficiency.

5. Response to change and innovation

Ultimately, the hybrid approach helps project managers to respond more effectively to change by using the Gantt structure to keep the project on track and the Agile methodology to integrate new ideas and innovations.

This improves the project’s ability to adapt to emerging challenges and promotes a working environment focused on innovation and continuous improvement.

Twproject: the ultimate solution for Gantt and Agile

Twproject stands out in the project management industry thanks to its superior solution that effectively integrates Gantt and Agile.

This tool is designed to simplify project management, making activity planning and monitoring more user-friendly, extremely flexible, and adaptable to different work contexts.

Twproject’s Gantt Chart is known as one of the best on the market for several reasons.

First and foremost, its user-friendliness does not come at the expense of power and versatility. Customers choose Twproject for its clear graphs, ease of monitoring project progress, and advanced features, such as visualization of task dependencies and real-time resource management.

The platform offers a wide range of dynamic features, including:

  • Real-time resource allocation: Twproject provides an easy way to monitor and modify resource allocations, quickly identifying any over or under-allocations.
  • Management of flexible working hours: It offers the option of setting customized work schedules for each team member, ensuring accurate work capacity planning.
  • Project status supervision: Through dedicated dashboards, Twproject provides a real-time view of project progress, making it easier to detect any critical issues.
  • Sharing and communication: The platform emphasizes the importance of communication in project management, providing tools for easy sharing of ideas, documents, and feedback.
  • Task planning and management: This software blends planning management with Gantt and task entry for the whole team, bringing projects closer to the day-to-day work of the resources.

Twproject‘s adaptability to different working methods, its user-friendly interface, and powerful features make it a must-have tool for project managers who want to optimize their project management, improving team communication and overall efficiency.

Plan your projects with Twproject

Project Management Basics: 4 Reasons to Use Gantt Charts

What is a Gantt Chart? Why it can be useful to manage your project?

If you have never heard of it, it’s important to know that Gantt diagram is a very versatile tool to visualize and track the timing and progress of a task.

Its representation is very simple: it is a Cartesian diagram, on abscissa you find the time scale from the beginning to the end of the project, while in the ordinate there are all the activities to complete it.

The planned time to perform a task is visually represented with a colored bar that runs from the start date to the end date of the task.

What is the purpose of the Gantt chart?

Managing projects with Gantt diagrams allows you to see at a glance the set of activities to be performed, which have closer deadlines, which can be done at the same time, and the entire dependencies grid.

They are universally used to plan and manage all types of jobs, from complex ones to simple personal ones, thanks to their immediate comprehension.

Let us look at the advantages of using Gantt.

With Gantt you can easily see:

  • The start and end date of a project
  • What is the sequence of tasks to be done
  • Who is working on the various tasks
  • How long each task will last
  • The dependencies between the various tasks

Below we explain how you can use them to manage your work project.

4 reasons to use Gantt diagrams:

1) Understand your project better

With the creation of the timeline, you and your team will have to highlight and break your project into phases and sub-phases.

This brainstorming will help you classify the entire work plan more accurately, highlighting more clearly the deadlines, the dependencies between the various steps, and also which figures will complete the various tasks.

This analysis is a key point in project planning and the Gantts will help you visualize it more clearly.

The first step is to create a work breakdown structure within which you can enter phases and sub-phases.

For simple projects, you can use a Excel spreadsheet, for the most complex ones, always in the interest of optimizing time and resources, you can use a project management software like Twproject, that allows you to quickly and easily set up various activities.

creation of WBS through Gantt

2) Define dependencies and deadlines

As mentioned in the previous paragraph, once the phases and sub-phases are identified with their duration, it will be much easier to set milestones and their dependencies.

Once you create these links you will be able to easily understand what impact can have a delayed task to a specific stage.

Being aware of this information at the beginning of the project, exposing what is called “critical path” (the sequence of dependent tasks that determine the end date), will allow you to pay more attention during its course.

Adding dependencies on Gantt

3) Delegate project activities

Identifying sub-phases will also help you figuring out which resources are going to accomplish them and so properly distribute your resource work load by improving human resource management.

Establishing the timeline will help you manage your project optimally, balancing your entire workload and avoiding overloads that would affect your team’s operational capability.

Moreover, the use of the Gantt is also fundamental in the case of project re-planning, thanks to which, with just a few simple changes, you can change the entire tree and immediately realise possible new overloads.

adding assignments on Gantt

Rescheduling activities can be even easier by relying on a project management software such as Twproject which offers the possibility of evaluating the load integrated into the project structure in the Gantt.

Twproject allows you to balance the load of resources by finding the earliest possible end date with a complex algorithm.

workload balance

4)  Check your progress

Project Gantt Diagrams, if created with a specific software like Twproject, are dynamic and evolve as a result of completing the various activities.

Thanks to this, you can constantly monitor job development by identifying progress and delays.

Applying Gantt’s diagrams to your project can therefore bring significant benefits:

  • Improve analysis and planning
  • Reducing errors and risks
  • Better resource management
  • Greater control

These aspects are crucial for every project manager who seeks to manage the work and the team optimally.

Gantt’s diagrams are, from this point of view, a powerful and immediately applicable tool.

In addition, with a specific tool such as Twproject, you will not only be able to monitor the progress of your project, but you will have the possibility, at any time, to compare the progress of your Gantt with its previous versions up to the baseline.ù

It will be easy to identify the phases that have generated the most delay and thus intervene in future cases.

project progress page

Workflow optimisation: one more reason to use the Gantt chart

If you want to optimise your workflow and ensure the achievement of your objectives, adopting a Gantt chart proves to be a strategic choice.

This tool not only facilitates the visualisation of the entire project lifecycle, but also enables the precise identification of critical phases and necessary resources.

In a context where every activity must be executed with precision and timing, the Gantt chart provides a clear and immediate overview of the project’s progress. This allows project managers to anticipate any delays or overlaps, ensuring that each phase proceeds on schedule. In addition, the tool’s ability to highlight dependencies between activities helps prevent bottlenecks and manage human and material resources more effectively.

In summary, the Gantt chart is not only a planning tool, but a true ally in optimal project management, essential for those working in the dynamic world of project management.

If you want to deepen your use by simple tests, by decomposing and analyzing your projects you can try Twproject for free, a comprehensive work management tool that includes an interactive tool for creating these diagrams.

Once you’ve downloaded the demo, you can start creating your own charts right away by dividing the job at various stages, assigning them to your employees. Twproject interactive tool will graphically show you the sequence of activities you enter by updating them progressively.

You can do all the tests you need and evaluate in depth the benefits this tool can bring to your work!

Do you want to create your first Gantt?

Planning a product launch activity with the Gantt

A product launch activity is a complex undertaking that requires careful planning.

The success of a product depends not only on its quality but also on the company’s ability to present it to the market in the right way, at the right time.

In this context, Twproject’s Gantt chart can be a valuable ally for project managers.

A successful launch can lead to increased sales, customer loyalty, and company growth, while a failed launch can result in financial losses and damage to reputation.

In this article, we will explore the different phases of a product launch, the activities essential for a successful launch, and see how the Gantt chart can be a valuable tool in all launch phases.

What is a product launch?

A product launch is when a company launches a new product.

This process involves the planning, execution, and promotion of the product to attract consumer attention and stimulate demand.

During the launch, the company seeks to create awareness, generate interest, and convince potential buyers of the product’s usefulness and value.

The successful launch of a product can lead to a competitive advantage, increased market share, and increased revenue.

But on what does the success of a product depend?

It depends on several key factors.

First and foremost, it is critical that the product offers unique value and addresses customer needs in a way that stands out from the competitors. In addition, careful planning, thorough market research, and a targeted marketing strategy are essential to reach the target audience effectively.

Product quality, clear communication, and a positive customer experience contribute to a successful launch.

What to know before planning a new product launch activity

Market research and product differentiation

Before launching a new product, it is crucial to conduct thorough market research to understand customer needs, the competitive environment, and industry trends.

Market research provides a detailed understanding of potential buyers’ needs, wants, and behaviors.

It allows you to determine your target audience, assess market demand, analyze competition, and evaluate market opportunities.

This information is essential to tailor the product to customer needs, differentiate the product from the competition, define an effective marketing strategy, and position oneself appropriately in the market.

Market research provides valuable data and insights to make informed decisions and increase the likelihood of successful marketing.

The importance of a unique and attractive product for the target audience

A company can identify what additional features or services may be considered unique and attractive to the target audience.

This stage is crucial to creating a product that stands out from competitors and responds more specifically to customers’ needs identified during market research.

One option for product differentiation could be to implement innovative features that solve problems or satisfy needs in new and surprising ways. These innovative features may have emerged during the market research phase, where it is understood what aspects are missing in existing products.

In addition, product design can play a key role in product differentiation. A distinctive and attractive design can arouse the interest and excitement of potential customers, helping to make the product more desirable.

Therefore, it is necessary to create a unique and distinctive value in one’s product that can attract potential customers.

Product differentiation helps position the product uniquely in the market, creating a competitive advantage and increasing the likelihood of success in the launch phase.

3 steps for planning a product launch activity

A product launch activity requires careful planning and a sequence of targeted actions.

1.    Pre-launch phase

Before launching a new product, it is essential to consider several aspects. These include defining the target audience, objectives, designing the strategy, and planning marketing activities.

The latter may include creating content for social platforms, attending trade shows, and sending press releases.

Let us analyze some main actions of this phase:

  • Create a roadmap: first, create a detailed roadmap that defines the phases, activities, and timelines of the product launch. This helps keep the project organized and under control.
  • Defining the target audience and objectives: The target audience must be precisely defined. Who are the product’s potential customers? What are their needs and expectations? This information is critical to designing an effective marketing strategy.

At this stage, setting clear, measurable goals and monitoring results in real time is important.

With Twproject, you can set specific metrics, such as the number of expected sales, new customer acquisition, or product adoption rate, and track progress through customized reports and dashboards.

  • Define strategies: The product launch strategy choice depends on the product type, target market, and business objectives. Evaluate different launch strategies: phased, simultaneous, or with special events.

Analyze the advantages and disadvantages of each strategy to make informed decisions based on data and business needs.

  • Doing pre-launch marketing: a proper pre-launch marketing strategy is key to creating hype and generating interest around your product.

With project management software like Twproject, you can manage all marketing activities, such as creating promotional materials, planning events, and managing advertising campaigns. You can also track customer interactions and feedback to improve your strategies.

The marketing strategy must be thought out according to the target audience and the product to be launched.

What communication channels are best suited to reach the target audience? What messages can be most effective? These are just some of the questions that need to be considered.

Marketing activities also need to be planned:

When and how will content be disseminated on social platforms? When and where will we participate in trade shows? When will press releases be sent out? These activities must be coordinated with each other and must be planned to maximize market impact.

  • Determination of product launch timing: accurate planning of launch timing is essential to ensure the product’s success in the market.

You can create a detailed calendar that displays deadlines and key debut events.

Monitor progress to avoid delays and ensure that everything is ready for launch.

  • Defining distribution channels: Choosing distribution channels is critical to reaching your target audience and maximizing sales.

Analyze the distribution channels, such as direct sales, e-commerce, distributors, or trading partners.

You can manage costs, assess the benefits and challenges of each channel, and make strategic decisions based on product and market needs.

  • Pre-launch monitoring: To ensure a smooth launch, keeping track of all activities and verifying that they are completed on time is important.

Creating to-do lists in Twproject lets you list all the tasks required for the product release.

You can also assign deadlines, monitor progress, and receive automatic notifications in case of delays or problems. This helps ensure that nothing is missed or forgotten.

2.    Execution phase

A product launch is critical when every detail can make a difference.

A delay in disseminating content on social platforms, for example, can reduce the impact of the marketing campaign. Similarly, a technical problem during a trade show can damage the product’s image and the company.

During the product launch, the Gantt chart in Twproject becomes an actual control center.

  • You can monitor the progress of activities in real time, identify any problems early, and take action to solve them.
  • It allows you to see on-time or late activities at a glance.
  • You can assign specific tasks to team members, track progress, and manage time.
  • It allows you to visualize dependencies, making it easier to coordinate activities. For example, the publication of a press release might depend on the completion of marketing materials.
  • The ability to share the diagram with the team facilitates communication and collaboration among members, helping to create a more effective and productive work environment.

3.    Post-launch phase

After launching your product, you should never let your guard down. It is essential to carefully monitor market results and feedback from potential customers and be ready to take corrective action if necessary.

Post-launch is a critical phase in which the company must be ready to respond quickly to market needs.

If the product is not received as expected, it may be necessary to revise the marketing strategy or make changes.

 Likewise, if the product is successful, the company must be prepared to handle increased demand.

In this context, the Gantt chart becomes a valuable support for project managers to effectively plan and manage post-launch activities and be in control of the situation.

As you can see from this tutorial, you can view each activity when it starts, when it ends, and how long it lasts.

  • Managing dependencies: Some post-launch activities may depend on others. For example, analyzing sales data before you can plan the next marketing campaign. You will be able to visualize these dependencies and manage the activities efficiently.
  • Resource planning: You may need to assign more staff to customer support if you expect increased demand after the product launch.
  • Time management: If a particular activity takes longer than expected, adjustments can be made to ensure that other activities are not delayed.
  • Communication with the team: The Gantt can help everyone understand what activities are in progress, what is next, and how they are related.

Twproject’s interactive Gantt has extremely intuitive features: add assignments, milestones and dependencies, plan ahead and monitor your progress

Planning a new product launch activity is a complex undertaking, but it can become a successful opportunity with the right tools.

As we have seen, Twproject‘s Gantt chart is ideal for tracking all phases. It is easy to use, versatile, and powerful, which can make all the difference in launching your project.

Plan your projects with Twproject

How to prepare a project with Gantt: key steps and tips

Preparing a project with Gantt is critical in ensuring efficient planning and optimal management of activities.

Using this visual tool, you can organize, assign and monitor activities, enabling precise control and better resource allocation.

In this article, we will explore how to prepare a project using Gantt and how to make the most of its potential.

6 steps to prepare a project

1. Analysis

The first step in preparing a project is to understand the context in which it fits.

During this preliminary stage, conducting a thorough analysis of the context in which the project fits is essential.

This involves carefully analyzing the environment, including customer requirements, available resources, time conditions, and technical constraints. Furthermore, it is critical to identify and anticipate potential risks.

The main objective of context analysis is to understand project stakeholders’ needs and expectations clearly.

This involves active dialogue with the client, project team, and other relevant stakeholders.

During discussions and interviews, it is crucial to ask targeted questions to gather critical information about project needs, wants, and restrictions.

In addition to understanding project needs, context analysis helps identify and assess potential risks.

This makes it possible to anticipate the challenges and potential complications that might occur during project execution. For example, financial constraints, technological limitations, or human resource issues could exist.

Early identification of such risks enables the project manager to plan mitigation actions and avoid unforeseen contingencies adequately.

During the context analysis, it is also important to gather detailed information on the availability of resources needed for the project.

This includes assessing the skills and capabilities of the project team and identifying the material and financial resources needed to achieve the established goals.

This information will be helpful in the next phase of activity definition and time planning.

2. Project type identification

For any project, clarity is the key to success.

There are different types of projects, each with its peculiarities and needs.

For project implementation, it is crucial to identify the type of project you are working on correctly.

For example, it could be a software development project, construction building, or marketing project.

Understanding the type of project helps define the activities and resources needed for its success.

The first thing to do is, therefore, to present the project clearly.

This implies accurately describing the project objectives, activities, and resources needed.

A good presentation of the project helps gain stakeholders’ support and approval and creates a solid foundation for its implementation.

3.Project objectives definition

 Once the context is understood and the type of project identified, the next step is to define the objectives. These must be clear, measurable, achievable, relevant, and time-bound, following the SMART (Specific, Measurable, Achievable, Relevant, Time-bound) criterion.

The project manager must work closely with stakeholders to ensure that goals are aligned with everyone’s expectations and needs. Once goals are set, they become the compass that directs all future decisions and actions.

4.Project planning

Project planning is a crucial phase that includes defining specific tasks, allocating resources and determining delivery schedules.

A good project management tool, such as Twproject, can facilitate this step by providing features that help create and manage the project plan.

During planning, the project manager must consider various factors, including budget, deadlines, team skills, potential risks, and client expectations.

Planning must be flexible and adaptable, as circumstances may change during the project life cycle.

5.Project monitoring and control

Monitoring the progress of the project and controlling its variables are essential to ensure that everything is proceeding according to plan.

Project management software such as Twproject, with its reporting and tracking capabilities, can significantly simplify this step.

The project manager can use these tools to monitor project progress, identify problems before they become critical, and make necessary changes in time.

6.Project closure

Finally, a good design must have a well-defined closure. This includes analyzing the results achieved, comparing them with the initial goals, and identifying strengths and areas for improvement. At this stage, it is also essential to recognize the contributions of all team members and celebrate the success achieved.

How to prepare a project: the Gantt chart with Twproject

gantt chart

After defining the project goals and the activities involved, you can proceed to create the Gantt chart

The diagram displays project activities along a time axis, giving the project manager a clear view of dependencies between activities, expected durations, and deadlines.

This can be created using specially designed project management software, such as Twproject, which simplifies the creation and management of these diagrams.

Creating the Gantt chart with Twproject is indeed simple and intuitive.

The latter provides a clear and detailed view of the activities, with respective horizontal bars representing the expected duration of each activity. In addition, you can customize the Gantt to suit your needs, including additional information such as resources assigned to each activity, milestones, or time constraints.

If changes occur in the planning or progress of activities, the necessary changes can be made directly in the diagram.

Dependencies between activities are automatically managed by Twproject, which adjusts the Gantt chart accordingly. This makes change and update management more efficient and faster.

In addition, the software allows sharing of work with the project team or stakeholders.

It is possible to export the diagram in different formats to facilitate communication and information sharing.

This way, all team members can have a clear and shared view of the project’s activities and execution time.

Analyze dependencies between activities with the Gantt Chart

Don’t limit yourself to sequential dependencies; also explore start-to-start, end-to-end, and other dependencies to represent complex relationships among activities

There are different types of relationships between activities in a project.

  • The so-called classical Finish to Start (FS) stipulates that activity A must finish before activity B starts, or in other words, activity B cannot begin before A is finished.
  • The Finish to Finish (FF) relationship implies that activity B cannot finish before activity A is also finished. This relationship is typical in scenarios where activity B depends on the completion of activity A, such as in the case of writing a book, where activity B represents the completion of the entire book and activity A is the writing of the last chapter.
  • Start to start (SS), in which an activity cannot begin before another activity begins. For example, the project management activity of a project cannot start before the project begins.
  • Finally, there is the type of relationship called Start to Finish (SF), in which activity A must start before B finishes. This relationship can be complex to understand and applies only in specific contexts. For example, in a manufacturing plant with shifts, the next shift (B) cannot finish until the initial shift (A) has started to ensure continuous machinery monitoring.

In Twproject, after creating the dependency between two phases, it is possible to change the default value represented by the FS dependency and select another relationship type. This expands the possibilities of dependency management and allows project managers to better adapt to the specific needs of their project.

We create and manage complex projects using Twproject’s interactive and user-friendly Gantt chart

Works on the elasticity of dependencies and flexibility in project planning

The elasticity of dependencies is a crucial factor to consider when developing a project with Gantt.

In many software, assigning a dependency involves a linear succession of activities without overlapping or empty time.

However, in the real world, the phases of a project do not always follow one another rigidly.

Twproject has introduced the ability to freely manage this elasticity.

When you insert a dependency, it is initially saved with the default FS hard type. However, converting this “hard” dependency to an “elastic” dependency with any relationship type is possible.

This means that two interdependent activities may not be chronologically consecutive, leaving gaps between them or overlapping for some time, as long as the logic of chosen dependence is respected.

This elasticity provides more flexibility in acting on the end dates of project phases without necessarily resulting in slippage of subsequent phases.

For example, consider a project tree in which a project manager (PM) is assigned for the entire project and a specific PM for each phase, such as analysis (PMA), design (PMG), and production (PMD).

Using elastic dependencies, the PM can define a total project duration and assign phases to a specific period. This allows PMs of individual phases more freedom of action in managing their phases’ start and end dates without interfering with the overall project dates.

Implements some time flexibility in the project Gantt

  • Time Buffers: insert time buffers between key phases to absorb any delays without affecting overall deadlines.
  • Periodic Review: schedule regular reviews of the Gantt to ensure that it always reflects the reality of the project.

Create selective access a project’s Gantt

Working with Gantt is great, but sometimes team members can get lost in the charts. To help the entire team focus on what is relevant, use Twproject’s features to grant selective access to the Gantt so that each team member can see only what is relevant to their role.

Create custom views and play with colors

– Customized Views: create customized views of the Gantt for different stakeholders, highlighting the most relevant information for each.

– Use of symbols and colors: use symbols and colors to make the Gantt more readable and to highlight key information.

Identifies Risks and prepares contingency plans

– Risk identification: uses the Gantt to identify potential risks, such as overlapping or conflicting resources.

– Contingency plans: prepare contingency plans for critical events and represent them in the Gantt so that you can act quickly if necessary.

Documents and archives project and Gantt evolutions

– Decision reporting: document key decisions and changes in the Gantt so that you have a historical record.

– Version archiving: save and archive key versions of the Gantt for future reference or post-project analysis.

Do you see how many things you can do with a Gantt in preparing a project?

Watch a short tutorial on the key points made so far

Indeed, preparing a project with the Gantt is a process that requires key setting of elements, good planning, a clear definition of objectives, and proper identification of activities and dependencies.

Using tools like Twproject and the Gantt chart, project managers can effectively manage projects, achieve successful results, and keep on schedule.

Still in doubt? Well, you can try yourself with a free demo.