Do you want to quickly find out which are the best Gantt chart software in 2024? We have drawn up a special list for you.
The Gantt chart is the best tool to get an overview of project performance.
It allows you to have the start and end dates of the project and its phases, their duration, their correlation, the assignees, all in one view.
As we shall see, there are many reasons to implement it, but to draw up a Gantt chart that is really useful and effective, we need the right tools.
Otherwise, we risk wasting a lot of time creating a merely theoretical plan, which will soon be abandoned and remain only in the initial plans of the project leader.
In fact, the key words for evaluating a good Gantt chart are in our opinion: dynamicity and shareability.
CONTENT
Origins and qualities of the Gantt chart
The Gantt has undergone many evolutions over time. Initially, it was a simple, static, time chart for initial planning.
Until not so many years ago, the Gantt was a theoretical structure that was designed at the start of a project, then printed out and hung on a wall in the workplace.
It was a simple benchmark, but unfortunately after a few days or weeks, the chart already became obsolete.
With the emergence of calculation software and then later with web tools, the Gantt became an operational tool.
Its function today does not end at the planning stage, but continues during project execution.
And this is why it must necessarily be integrated and interoperable with other tools. Nowadays, the Gantt chart only makes sense if it is dynamic, sharable, updatable in real time.
Here are in detail the two aspects we took into account the most during our analysis in search of the best software for creating Gantt charts.
First quality of the best Gantt chart: dynamicity
By ‘dynamic’ we mean both the interactivity of the Gantt and its integration with other working tools.
In fact, a good Gantt chart must be able to evolve as various activities are completed. And of course, it is better if this evolution takes place in an automated way and in real time.
At the same time, the information that allows the Gantt to change and progress comes from other sources, such as worklog data, calendar and ToDos performed.
Conversely, the assignments distributed through the Gantt make up and update the 0perators’ workload; its duration affects budget estimates and many other aspects of project management.
This explains the relevance of the Gantt chart in a project management software: it is the starting point and the core to which everything leads back.
The tools we have included in our list of the best Gantt chart software possess this quality!
Second quality of the best Gantt chart: shareability
Together with the interactivity of the Gantt, the group of actors involved in the use of this chart has expanded.
We are talking about the actual project executors, but also about the stakeholders: each resource has its own specific reasons for keeping an eye on the Gantt.
Having a Gantt at hand when we are presenting a project and being able to act within it in real time during meetings is definitely a good practice.
This increases the involvement of the parties and helps achieve a holistic view.
In addition, the most advanced tools also have very customisable role permission systems that allow certain aspects of planning to be delegated.
For example, the project manager may need to entrust the planning of certain project sub-phases to other collaborators, and good software must in our opinion allow for this elasticity on permissions.
But let us finally come to our ranking of the best Gantt chart software, bearing in mind the aspects we have highlighted so far, and see who and how performs the work best.
Here is the list of the best Gantt chart software:
1. Twproject
Let’s start with what is considered by many to be the best Gantt chart on the market: Twproject, a software that has made this chart its strong point.
Twproject was founded in 2001, but only from its fifth release did it integrate the Gantt among its tools.
Its team waited until they had the technological maturity to develop a tool that had real utility and was not equivalent to graphing on a spreadsheet.
Since then, however, Twproject has ensured that its Gantt chart became increasingly comprehensive and interoperable, always adding new optimisations and functionalities.
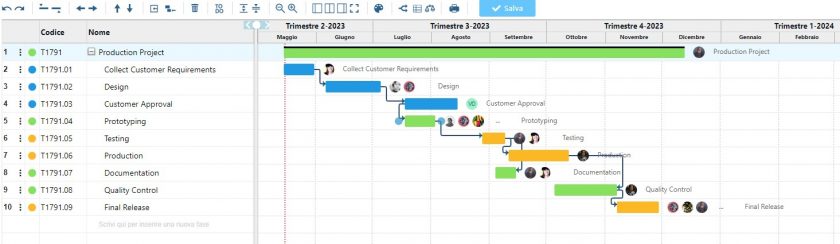
Twproject stands out by having a rather customisable and realistic Gantt that truly reflects the progress of projects.
The elasticity of Twproject’s Gantt is remarkable, but at the same time this tool is extremely precise and its interaction with the other elements of the software is total and accurate.
Last but not least, Twproject guarantees the possibility of keeping track of all previous changes made to the Gantt chart, thanks to the timeline: with this, you can scroll back in time and review the Gantt chart structure at any desired date.
Best features:
- Overview or detailed view: possibility to have a lower or higher detail level and zoom in on individual phases of the WBS
- Creation of phases and milestones: from list or drag and drop, as preferred
- Assignment of phases: possibility to set assignees directly from the Gantt
- Integration with workload: warning of overloads and reallocation with ‘magic wand’ tool
- Critical path: possibility to check crucial nodes of project development
- Timeline: user-activated project change history
- Dependency types: in addition to the classic Finish to Start dependency, three more dependencies are available to better accommodate different work dynamics
- Elasticity: possibility of having non-sequential dependencies
- ToDo view: side-by-side and integrated ToDo management for each project phase
- Role and permission management: possibility of assigning the planning of various phases to different users
- Sharing: exportability in various formats
Pricing: from € 7.89 per user/month.
Pros: Twproject makes it possible to create a Gantt chart that is unrivalled in terms of user-friendliness, accuracy and variety of functions. Thanks to constant feedback from its users, this product is constantly evolving and improving.
Cons: Frankly, it is difficult to find a single negative aspect in Twproject’s Gantt.
With Twproject, you never have to enter information twice: everything is designed to optimise working time and offer a useful tool in daily operations
2. ClickUp
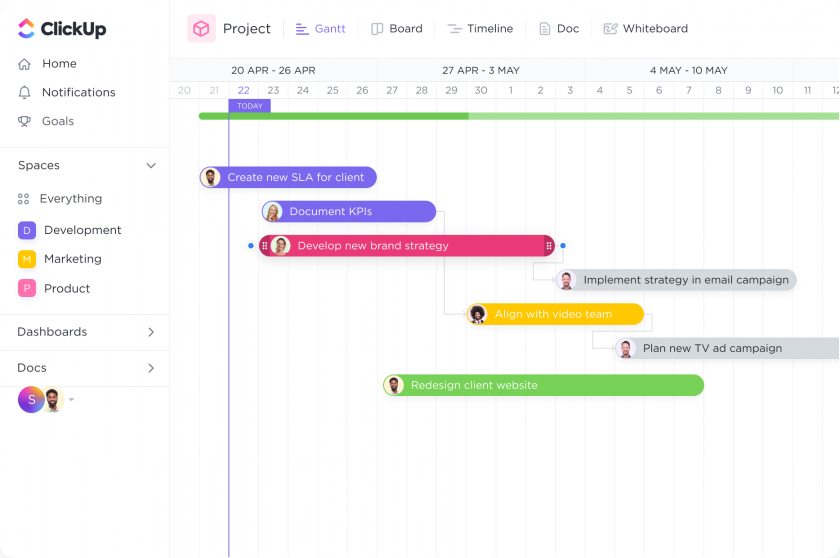
The Gantt that can be created with ClickUp has a good overview of the entire project, which is also highlighted by the green bar that encloses all project phases, showing the total duration at a glance.
On each step, the name of the assignee is clearly visible, but other information, such as the percentage of work done, is missing.
There is a general lack of connection with the resource load.
As there is no difference between activities and project phases in Clickup, the Gantt chart is very quick to create and manage.
However, this can be a disadvantage when it comes to complex projects or projects with many micro-tasks to perform and keep track of.
Best features:
- Hierarchical structure: Spaces > Folders > Lists
- Lists of tasks have their own Gantt
- Tasks that can be entered directly on the gantt by dragging and dropping
- Secondary opening of the related tab with various detailed information
- Duplication possibility
- Wide range of customisation possibilities
Pricing: from $ 7 per user/month.
Pros: ClickUp has an attractive interface, and its Gantt is no exception. It makes the agile philosophy its strong point.
Cons: It lacks some advanced features and at first glance its Gantt editor can appear a little chaotic.
Agility and aesthetics combine in a tool that is quick to use but not always complete in its functions
3. GanttPRO
With almost diametrically opposite characteristics we find Gantt PRO.
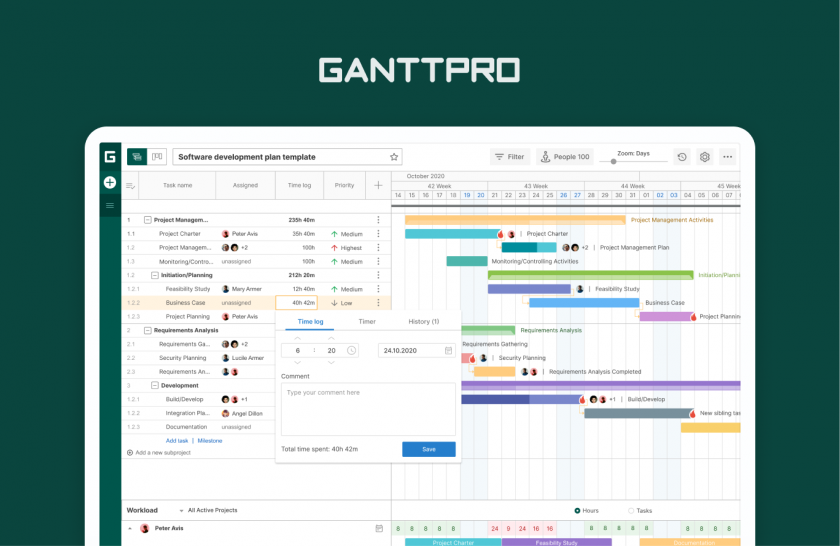
As its name suggests, it is a software totally dedicated to the Gantt chart.
Project planning starts precisely from the Gantt view, with a WBS side-by-side, in which projects and task lists are entered.
Alongside the Gantt, there are also secondary views, such as the Kanban board, operator loading and reporting.
Some secondary functions such as budgeting and time tracking are only available in advanced licences.
Best features:
- Fixed hierarchy of projects and task lists
- Various baselines can be created
- Percentage turnaround that can be set directly on the task by dragging and dropping
- Dependencies with Finish to Start or Start to Start type
- Gap between dependencies settable in hours
- Critical path
Pricing: from $ 9.99 per user/month.
Pros: It turns out to be a good technical product, with a simple, clean interface and few but clear functions.
Cons: It has a somewhat dated appearance and is little or no customisation. Some secondary functions such as budgeting and time tracking are only available in advanced licences.
If the objective is to create accurate Gantt charts, it may be a solution, although lacking in interoperability with other management tools
4. Smartsheet
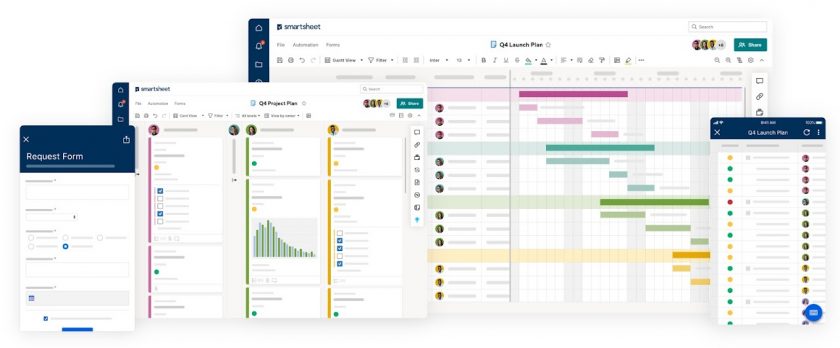
It is a software that plans to replace Excel spreadsheets for business management, and thus closely replicates its functionalities.
Smartsheet is a tool consisting of many combined elements, with the addition of typical project management tools.
The data entered in your worksheet can then be interpreted through the various views, including the Gantt view.
It is therefore a tool that requires good expertise in the use of calculation formulas.
Best features:
- Customising phase colours
- Conditional formatting allowing the setting of customised rules for the display of phases
- 4 zoom levels: quarter – month – week – day
- Secondary views: list, calendar and board
- Critical path
- Percentage of work done shown on phase
- Task duration: shown only when dependencies are activated
Pricing: from $ 6 per user/month, for up to 10 users.
Pros: The main feature of Smartsheet is the possibility of customisation, both graphically and in terms of the method used.
Cons: Lack of automation and the need to master the calculation formulae for its use.
Technical tool with refined functionality, but not exactly useful for saving time in planning
5. Toggl Plan
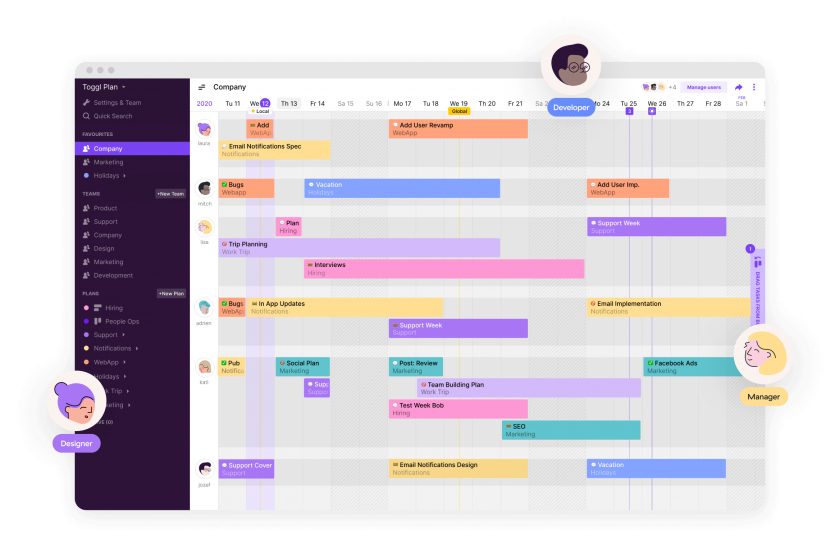
Toggl strongly focuses on the human resources aspects of the projects.
It is therefore very much geared towards managing tasks and assignments in a smooth manner, particularly through its Gantt editor, but not only.
The special feature of the tool is that it allows you to create resource-specific, as well as project-specific, Gantt charts.
It could therefore be useful for those who specifically deal with scheduling and balancing the working time of human resources in a company.
Best features:
- Data sharing to external users also
- Estimated vs. actual progress
- Good integration with resource load, which is visible at the same time
- 4 zoom levels
- Drag and drop for duration and dependencies
- Colour customisation of assignments
Pricing: from $ 9 per user/month.
Pros: In general, it is easy to use and has a modern, user-friendly interface.
Cons: Perhaps also because of its easiness, it has some limitations, especially when it comes to integration with other views of the software.
Agile and easy-to-learn software, more useful if the work is set up in a resource-oriented manner
6. Team Gantt
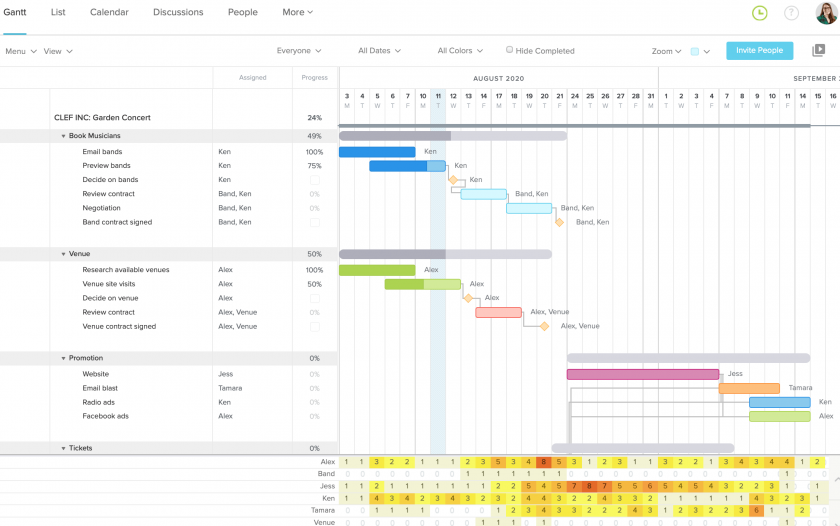
Here again we are in front of a tool that starts projects directly from the Gantt.
Only at a later stage, one can add tasks and distribute assignments.
Almost all of its functionalities relate to the Gantt chart and many interactions can be done directly from this view.
A limitation is the fact that tasks and ToDos are not distinct from each other. In addition, all tasks related to a project are always visible on the Gantt, making the management of complex projects somewhat difficult.
Best features:
- Ability to add notes and attachments to tasks
- Possibility to enter the percentage of task completion
- Workload view openable from Gantt
- Total view of the number of tasks assigned per person in days or hours
- Health report
- Secondary views: list, calendar and board
Pricing: from $ 8 per user/month.
Pros: A detailed and very specific tool for creating Gantt charts, with some useful customisations.
Cons: Among the customisations, the differences between dependencies and their elasticity unfortunately do not appear. Furthermore, due to an excessive level of detail by default, the Gantt loses its primary function as a comprehensive overview tool.
Suitable for those who need to create many Gantt charts for small projects but somewhat lacking in cases of complexity
Bottom line
We have tried to help you choose the best Gantt chart software for your projects.
In conclusion, keep in mind that if you decide to try to Twproject:
- its interaction with ToDo lists makes it possible to overcome the classic Waterfall vs. Agile opposition, and creates a new structured yet dynamic approach.
- The possibility of having a timeline that allows you to go back to the planned structure at any time, right from the start of the project, makes Twproject’s Gantt chart the best planning tool. In fact, it allows us not to miss any important data and to be able to reschedule freely and without delay during project implementation.
If you wish, you can tell us if this analysis was useful to you and start creating a Gantt chart in the best possible way right away: with Twproject you can try it out for free for the first 15 days.