|
Getting your Trinity Audio player ready...
|
Gantt vs. Pert are two of many different project management planning tools available.
They aim to help project managers accomplish their work better by facilitating activity coordination and stakeholder communication.
These diagrams help manage the challenging constraints of time, cost, and scope, which are the predominant forces in any project.
Let’s look at the comparison of the Gantt vs. Pert tools in detail.
CONTENT
What is a Gantt?
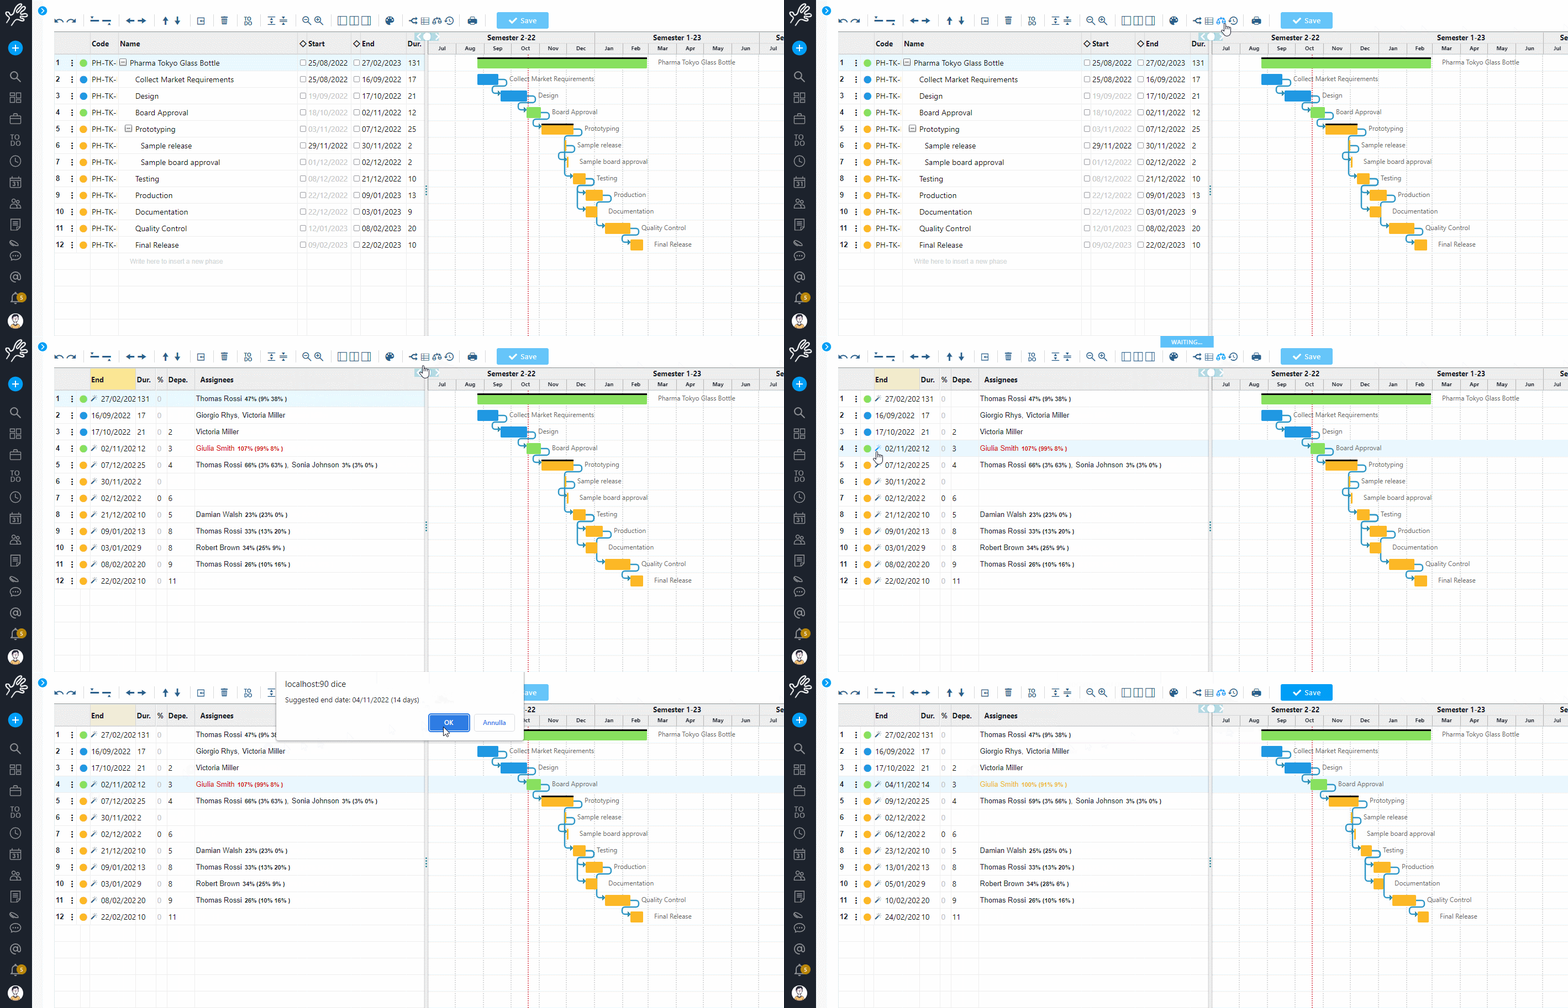
A Gantt chart is one of the most popular ways to show activities by time, as it is a core project management tool for planning and scheduling (learn more at How to make a Gantt chart).
Specifically, it consists of two axes:
- A vertical one consists of a list of activities that must be accomplished to complete the project.
- A horizontal one represents the timeline of a plan, in which the bars are the activities set in chronological order.
This system allows all stakeholders to be provided with the same information and shared expectations.
Plus, the Gantt chart, thanks to its graphic time sequence, clearly shows how activities are related to each other, making it one of the best visualization tools in project management.
The clarity with which a Gantt displays this information helps considerably with management and communication within the project team.
When is it appropriate to use a Gantt chart?
The Gantt chart is arguably the most flexible project management tool available: not only is it used during the planning phase of the project, but it is also useful throughout the execution phase to monitor progress.
Therefore, project managers use Gantt charts to get an overview of the project at any given time, create and assign tasks, monitor their budget, manage resources, and much more.
With this tool, you can ensure everyone can access any schedule and project details in real-time.

Gantt can be used in many scenarios, but it is particularly beneficial when:
- Project activities are well-defined and neatly arranged. A Gantt chart is great for visualizing a series of activities in a precise sequence. However, if activities are still loose or the order is unclear, this chart may not be very helpful.
- The project has a set duration: The Gantt chart is useful for monitoring progress over time and identifying any delays. The diagram may not be the best option if the project duration is uncertain.
- The project is small or medium-sized: Gantt charts are easier to manage for projects involving a limited number of tasks. For very complex projects, they may be difficult to interpret and keep up to date.
- You need to communicate your project plan to a team or client: The Gantt provides a user-friendly visual representation of the project, making it easy for all stakeholders to understand.
Besides these cases, the Gantt chart can also be useful for:
- Manage project resources;
- Identify dependencies between activities;
- Estimate project duration;
- Monitor project costs.
What is a PERT chart?
PERT stands for “Program Evaluation Review Technique” and is a project management tool that visually represents activities and dependencies of a project.
In this chart, we use arrows to show the activities required to meet a given event, symbolized by a node. As a result, a node represents a completed phase of the project.
Therefore, a PERT chart looks like a network diagram, where each separate box (or node) represents a project activity. Arrows show the dependencies between activities, connecting them.
When should you use a PERT chart?
A PERT chart provides a visualization of the entire project timeline in a chart that is easy for team members and project stakeholders to understand.
Moreover, the PERT chart allows project managers to learn and keep track of important workflow information: task dependencies, estimated task time, and minimum project delivery time.
Therefore, it is mainly suitable for all projects except small ones, where checklists are good enough to get the big picture.
PERT can make the workflow smoother when:
- The plan involves multiple activities running simultaneously: In this case, the diagram will make the prioritization process easier, helping to understand which activity depends on another.
- The project has a strict time frame: A PERT chart is not only a visual representation of a project’s structure but also helps gauge its duration. This tool allows you to set deadlines and stick to them.
Here are some cases where you should use a PERT chart:
- Projects with many unknowns: The PERT chart is particularly suitable for managing projects with many variables and uncertainties, where the exact duration of activities is difficult to estimate.
- Projects with many interdependent activities: If project activities are interdependent and the delay of one may affect the others, the PERT chart helps to map out the critical path and manage any potential issues.
- Long-term projects: It helps estimate the duration of long-duration projects, which are spread over several months or years.
- Projects with limited budgets: PERT can help optimize resource utilization and reduce project costs.
Besides these cases, the PERT chart can also be useful for:
- Identify project risks;
- Evaluate different project alternatives;
- Communicate the project plan to a team or client.
Gantt vs. Pert: two tools in comparison
Gantt and Pert charts offer unique approaches to planning, executing and monitoring projects, each with strengths and ideal applications.
Twproject integrates both of these tools, empowering teams to choose the approach that best suits their needs.
Twproject’s Gantt, which is a bar chart, provides a visual representation of project progress by showing activities as horizontal bars running along a project timeline.
This user-friendly layout provides project managers and team members with a convenient way to see the sequence of activities, their durations, overlaps, and time dependencies at a glance.
It is particularly useful for projects with a clear, sequential structure, where planning and time tracking are crucial.
Let’s take a look at the pros of the Gantt chart:
- Immediate visualization: It provides a clear and straightforward overview of the project’s progress.
- Resource monitoring: It helps to assign and monitor resources, displaying who is working on what and when.
- Deadline management: It helps to identify and manage deadlines, making it easier to adjust plans according to changes.
Twproject’s PERT chart, on the other hand, focuses on analyzing and planning activities based on their interdependencies.
It uses nodes to represent activities or events and arrows to show precedence relationships between them. This approach is especially useful in complex projects, where finding the critical path and understanding dependencies between activities are critical to project success.
Let’s take a look at the pros of the PERT chart:
- Critical path analysis: Identifies critical activities that cannot be delayed without affecting the project deadline.
- Time optimization: It helps optimize project plans, allowing better allocation of time and resources.
- Risk management: It provides a foundation for risk analysis, allowing potential snags to be predicted and mitigated.
In short, we have seen that both Gantt and PERT charts are visual tools for organizing activities during project planning.
The choice between Gantt and PERT depends on your unique project needs.
The PERT chart is great as it clearly shows dependencies between activities and the critical path.
This means that a project manager can make better decisions by managing data and performing what-if analysis.
The downside is that it is difficult to scale a PERT chart, and this can be an issue when working on more complex projects. The larger the project, the more complex the PERT chart will be and the more difficult it will be to interpret.
A Gantt chart allows a project’s time sequence to be displayed in a more structured fashion. It also allows work progress to be clearly visualized in real-time.
Therefore, a good project manager typically uses both techniques to fulfill multiple purposes.


