“How to make a Gantt chart” is the starting point for all those who want to organize their workflow effectively.
A Gantt chart is a key tool for project planning and tracking. But how can you make an effective Gantt?
This article will explore the basic steps to create a simple and effective Gantt chart.
What is a Gantt Chart?
Before delving into the “how,” it is necessary to understand the “what.”
A Gantt chart is a visualization tool that allows project managers to map a project’s path from start to finish effectively.
Developed in the early 20th century by the mechanical engineer Henry Gantt, this tool has since evolved into one of the staples of modern project management.
Specifically, it is a type of bar chart that illustrates a project’s schedule, showing the different activities to be carried out on the vertical side and the expected timeframe for each of them on the horizontal axis.
Each bar in the chart stands for a specific activity in a project, with the length of the bar representing the expected duration for completion of the activity.
What makes the Gantt chart so precious is its ability to provide, at a glance, a detailed overview of how and when the various activities overlap, allowing project managers to optimize resources and better manage time.
Why use Gantt for your project workflow
Adopting a Gantt chart in your project workflow is recommended and a real winning strategy for any project manager.
This tool provides a straightforward view of each project phase, from each task’s start and end dates to the overlap between tasks and their duration.
But why is it so critical to the workflow’s success?
First of all, Gantt makes project management more accessible by allowing the selection of relevant data with precision and the visualization of the time axis format in a user-friendly manner.
This helps to immediately understand the sequence of activities and their interdependencies, improving planning and resource allocation.
Furthermore, visualizing distances between bars and stacked bars makes optimizing the time-space and preventing work overload possible.
Using a Gantt chart also supports selecting the most suitable format to visually represent the project, allowing you to include legend items and organize categories in reverse order, if necessary. This flexibility results in a better comprehension of the workflow by the entire team, streamlining communication and collaborative efficiency.
How to make a Gantt chart
Creating and using a Gantt chart are key steps in project management, providing a visual snapshot of a workflow.
Here are some guidelines for creating a Gantt chart:
1. Identify activities
The first step in creating a Gantt chart is establishing all the tasks required to complete your project. This includes large and small tasks, from the obvious ones to those that could easily be disregarded. Each task must be listed to be clearly displayed in the diagram.
2. Define dependencies
After having listed your tasks, the next step is to set the dependency relationships between them. This involves determining which activities must be completed before others can begin. This step is critical for creating a logical workflow and avoiding bottlenecks along the process.
3. Assign durations
Each task included in your Gantt chart must be given an assigned duration.
This not only includes the time required to complete the task itself but must also consider any dependencies that might affect its start or completion. The duration may be estimated in days, weeks, or months, depending on the scale of your project.
4. Calendar development
With the activities, dependencies, and durations in place, the next step is to develop your project schedule. This involves assigning specific start and end dates for each task, with consideration of dependencies and available resources. The schedule must be realistic and flexible, accommodating any changes.
5. Use the right tool to make your Gantt chart
Using a dedicated project management tool, such as Twproject, can considerably streamline this process. This tool has advanced features, such as easily updating tasks and their dependencies, checking real-time progress, and collaborating with team members.
6. Monitoring and updates
After creating your Gantt chart, your work is not over yet.
This chart must be regularly updated and monitored to reflect the progress of the project and any changes in the plan. This helps keep the project on track and pinpoint any delays or problems at an early stage.
But that is not all. The Gantt chart should be shared with your entire project team. This ensures everyone knows deadlines, priorities, and the overall workflow. Effective communication is crucial to the success of any project.
Make a Gantt chart with Twproject: the ultimate solution for effective charting
Twproject offers a user-friendly graphical editor for creating Gantt charts, which can be accessed by clicking the button at the beginning of the WBS.
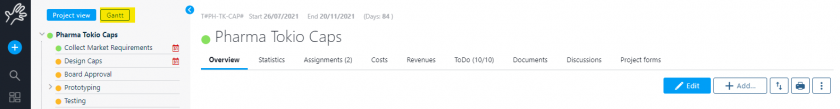
Those familiar with MS-Project will appreciate Twproject’s editor’s user-friendliness while noting significant differences in data models and usage dynamics.
Twproject’s main objective is to track work progress in real-time and adapt to dynamic and changing situations. This feature differs significantly from traditional project management, which involves detailed and advanced project definitions, often unrealistic in many work contexts.
Twproject adopts a distinctive model for organizing the project tree, deadlines, and statuses, diverging from the traditional Gantt chart. Projects can remain active beyond their scheduled deadlines or be temporarily suspended, thereby reflecting a more flexible schedule and dependency management.
Upon accessing your Gantt editor, you will find the WBS node you are exploring. The changes you make will only take effect once you press the “Save” button, allowing you to experiment with your project structure without altering its original configuration.
Grid panel
The project tree interface is structured in two main sections, divided by a movable vertical line. This divider can be moved to the right or left to suit your work area better. The section on the left includes the text panel.
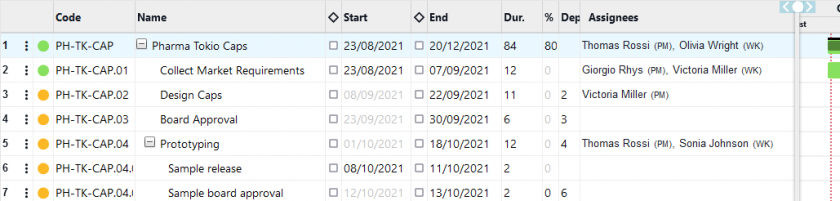
You can expand columns by dragging them and directly edit details such as code, name, dates, and dependencies by simply clicking on specific fields.
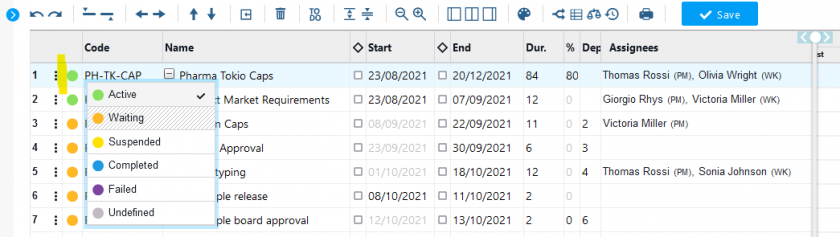
The project layout can be compressed; the system will save this visualization choice. You can also change project statuses via the status indicator.
Having established the dependency between the two phases, you can change the default Finish to Start (FS) relationship, opting for a different type of connection.
Moreover, Twproject allows that interconnected activities do not necessarily have to follow one another sequentially but can overlap or be spread apart while still following the chosen dependency logic.
This flexibility improves compliance with project reality and reinforces the concept of delegation.
Elastic dependencies offer project managers the option of managing project phase schedules with greater freedom, without changes in one phase automatically leading to shifts in subsequent stages, thus promoting a more dynamic and customized approach to project planning and execution.
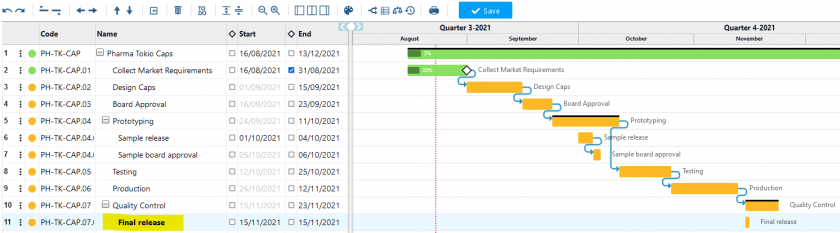
Gantt Panel
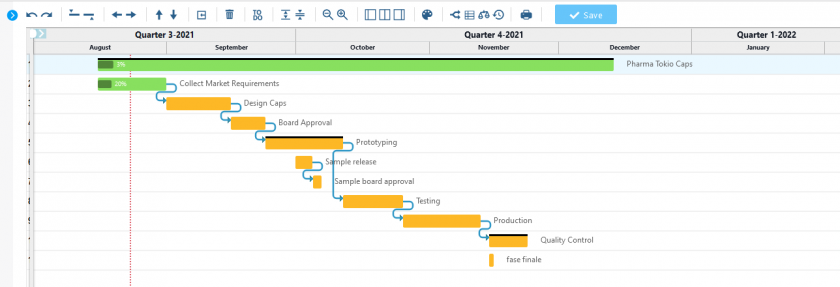
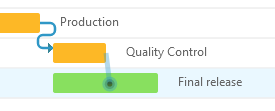
On the right-hand side of the interface, which graphically represents your project timeline, you can move the different phases of your project temporally by dragging and dropping them, changing all dependencies accordingly, where feasible.
Positioning your pointer at the beginning or end of a project or phase will turn into a bi-directional arrow, allowing you to extend or reduce the duration of the relevant project or phase. Again, the associated dependencies will be adjusted, always within the constraints set by the project.
Actions performed within the panel are bound by the limits and restrictions of the project and will only be allowed if they do not meet these constraints. For example, you cannot move a milestone if it has already been defined.
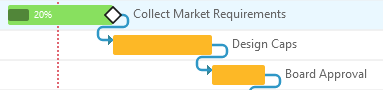
Using the Gantt panel, you can also set up new dependencies between project phases by dragging dependency markers to other phases and changing the associated states accordingly.
To create child tasks, all you have to do is write their name in the ‘name’ column.
Then, you can set the start and duration by dragging the bar from the graphic part or manually writing dates in your columns.
Recently, we introduced a new feature that integrates ToDo lists with the Gantt chart to make it easier to manage project meetings (learn more here).
This new feature allows the planned activities in the Gantt chart and the details of the ToDo lists to be displayed simultaneously, making it easier to understand the progress of the project and the individual tasks to be completed.
Watch our tutorial to learn how to make an effective Gantt chart step by step:
Making a Gantt chart means having in-depth control over each task and its start and end dates and being able to plan precisely, anticipate risks, and manage resources efficiently.
Whether managing small projects or orchestrating large initiatives, the Gantt chart remains an indispensable ally for anyone who wants to complete their projects efficiently.