|
Getting your Trinity Audio player ready...
|
Why create a Gantt Chart? What is it and why is it important in projects?
If you are starting to immerse yourself in the world of project management, then you should familiarize yourself with this essential tool in this industry.
Its importance in the context of project management lies in its capability to help you organize activities logically and sequentially, identify dependencies between activities, allocate resources effectively, and keep track of overall project progress.
In this article, we will explore together what a Gantt chart is, why you should use it, and how Twproject can revolutionize your approach to project management.
CONTENT
Gantt Diagram: what is it?
The Gantt chart, which bears the name of its inventor, Henry Gantt, is a visual tool used in project management to portray activity planning over time.
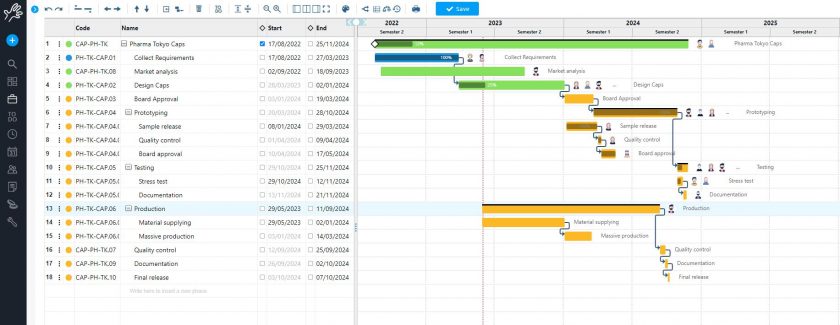
This tool appears as a horizontal bar chart, where each bar stands for a specific project activity, its duration, as well as its planned start and end.
The key to the success of a Gantt chart lies in its power to provide an at-a-glance overview of the project’s progress, allowing project managers and team members to understand deadlines, dependencies between activities, and resource allocation easily.
It also facilitates the identification of potential schedule delays or conflicts, allowing real-time changes to be made to keep the project on track.
Thanks to its simplicity and effectiveness, the Gantt chart has become an indispensable tool for managing projects of any size and complexity, promoting clear communication and improving team efficiency.
Key elements of a Gantt chart
Gantt, with its user-friendly visual structure, comprises several key elements that make it easy to read and interpret. These elements are central to understanding at a glance the progress of a project, its timelines, and the relationships between the various activities.
Here are the key elements of a Gantt chart:
1. Horizontal bars
Horizontal bars are the most distinguishing element of a Gantt chart. Each bar represents a specific activity in the project, with the length of the bar expressing the duration of said task. The position of the bar along the time axis shows the expected start and end of that task.
2. Time axis
The upper or lower horizontal axis of the diagram shows the total time frame of the project, which is divided into time units (days, weeks, months). This axis makes it possible to visualize when activities should begin and end, providing an overview of the project timeline.
3. Activity list
On the left-hand side of the diagram, there is a list of all activities planned in the project. These are usually arranged in sequential or logical order and can be grouped by phases or work areas, making it easier to understand the structure of the project.
4. Milestones
Milestones are visual indicators, often represented by symbols, that mark critical points or significant objectives within the project. They have no duration but mark key moments such as the completion of a critical stage or the delivery of a deliverable.
5. Dependencies between activities
Dependencies show relationships between activities, indicating how the completion of one activity influences the start or completion of another. These are often expressed by arrows or lines connecting the bars, highlighting the logical sequence of activities and their interdependencies.
6. Activity progress
Some Gantt charts provide a visual representation of task progress, with partially filled-in bars to indicate how much of the task has been completed. This makes it easy to compare the actual progress with the original planning.
7. Allocated resources
In more detailed versions of the diagram, it may also be specified who is ultimately responsible for each activity or what resources have been allocated. This element helps to manage human and material resources better, ensuring that each activity has the necessary resources to be completed.
8. Colours and codes
Using different colors or codes can help to quickly differentiate between different activity categories, project phases, or priority levels. This design element further increases the diagram’s readability, allowing an immediate understanding of the project status.
These key elements make the Gantt chart an extremely powerful tool for planning and monitoring projects, providing a clear and understandable view of progress and facilitating resource and time management.
Why use the Gantt Chart in project management
After having shed some light on what a Gantt is and what it is about, let’s take a look at its benefits.
Using a Gantt chart in project management is not just a matter of convention or convenience – it is a strategic choice that brings with it many significant advantages. This tool proves to be vital in tackling the complex challenges of modern project management, thanks to its ability to simplify the planning and monitoring of activities. Now let’s take a look at why the Gantt chart is so valuable:
- Clarity and immediate grasp: The first and arguably most apparent advantage of the Gantt chart is its visual clarity. The graphical portrayal of activities on a time scale makes the duration of each activity, overlaps, dependencies, and margins for flexibility immediately obvious. This helps all team members to quickly understand how their work fits into the larger project context, facilitating planning and self-organization.

- Better internal communication: The transparency offered by the Gantt chart improves communication within the team significantly. Each member can visualize not only their own activities but also how these relate to the work of others. This promotes a sense of collective responsibility for the project and helps to prevent misunderstandings or overlooking deadlines and priorities.
- Time management optimization: By visualizing durations and dependencies between activities, Gantt charts help project managers optimize resource allocation and time planning. By pre-emptively identifying potential conflicts or overload periods in advance, it is possible to redistribute resources or revise deadlines to keep the project on schedule.
- Facilitazione della pianificazione e del monitoraggio: Gantt chart is not only a planning tool but also a monitoring tool. It makes it easy to compare the actual progress of the project with the original planning, highlighting any delays or deviations. This is crucial for taking timely corrective action and ensuring that the project stays on track.
- Decision support: when facing uncertainty or needing to make quick decisions, the Gantt chart provides a robust basis of objective information. Visibility into how various activities affect each other helps managers assess the consequences of any changes, supporting informed and strategic decision-making.
- Versatility and adaptability: The Gantt chart is fit for projects of all sizes and industries. Its versatility makes it a precious tool for project managers working in diverse contexts, always offering a solid support structure for project management.
Gantt Chart: Which software to choose?
Beginners often resort to Excel for project management, mainly because it is familiar and seemingly simple. However, this choice can prove counterproductive.
Despite being a powerful tool for data processing, Excel is not optimized for project management and presents several limitations that can compromise effective project planning and monitoring (learn more here).
Evaluating project management software is a pivotal process to ensure that the chosen tool aligns effectively with the needs of the team and the project.
Twproject stands out as the best software on the market for creating Gantt charts for several key reasons that meet the needs of project managers.
These aspects make it well suited for those seeking not only to plan activities effectively but also to monitor project progress in real time, manage resources efficiently, and facilitate collaboration between team members.
Here’s why Twproject is the right choice:
1. User-friendly and customizable interface
Twproject offers a user-friendly interface that makes it easy to create and manage Gantt charts.
Users can easily add, edit, and arrange tasks, sub-projects, and milestones with just a few clicks. Advanced customization allows the Gantt to be adapted to the specific needs of the project, improving readability and understanding of the project status by all team members.
2. Advanced dependency management
Unlike other tools that offer limited functionality, Twproject makes detailed management of dependencies between activities possible.
This includes the option of defining complex relationships, such as flexible dependencies, which better reflect the dynamic nature of modern projects, allowing for more realistic and flexible planning.
3. Real-time collaboration
Twproject simplifies collaboration between team members by providing them access to the Gantt chart, viewing assignments, updating task status, and sharing documents in a centralized environment.
This considerably improves communication within the team and with stakeholders, reducing the risk of misunderstandings and accelerating the decision-making process.
4. Monitoring and reporting
Managers enjoy powerful tools for monitoring project progress and generating detailed reports. This way, they have a clear picture of the project’s progress, identify any delays or problems at an early stage, and make informed decisions to keep the project on track.
5. Efficient resource management
In resource management, Twproject offers powerful functionalities for allocating and monitoring human, financial, and material resources. Users can easily overview resource availability, prevent overloads, and optimize resource allocation to maximize project efficiency.
6. Scalability
Twproject is designed to fit projects of all sizes and complexities, making it a scalable solution that can grow with your business. No matter whether managing a single project or coordinating a portfolio of multiple projects, Twproject offers the functionality and flexibility to manage projects in different scenarios effectively.
Making a Gantt chart with Twproject is an easy and intuitive process, so you can focus on what matters: successfully completing your project.
Remember, the key for a project manager is not only knowing the right tools but also knowing how to use them at the right time.
Twproject is here to guide you through every step of your journey, making project management a smooth and rewarding experience.


