The Timeline is a very useful tool designed to constantly track the progress of your projects.
With the Project Timeline you can keep track of changes and events that have happened over time; it is in fact the historical memory of a project.
CONTENT
Thanks to its slider, you can “navigate” back and forth in time and see the initial situation; you can see what and when it has changed from the baseline (i.e., the initial planning), pointing out the highlights.
Twproject offers you an incredibly functional and complete version of it. Want to discover this timeline with us? Here’s everything it allows you to do.
Features of the Timeline on the Statistics page
On the Statistics page, in the tab following the Project Overview, you will find everything you need to make a comprehensive and accurate project monitoring and tracking plan.
And this is where we placed our Timeline, to have at first glance a dynamic temporal line: this allows us to immediately see the dates of relevant changes from the initial planning (baseline).
The baseline, as the word implies, is in fact the base of the project, established before the project is started. It is meant to capture the initial situation, to see if and how far we will deviate from it later.
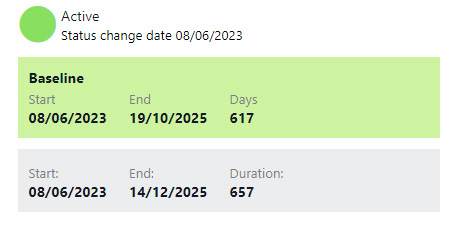
It mainly includes: timelines (start and end date), expected costs, and resources involved. In Twproject it is always visible in the Statistics page.
But as we know, it is natural for these variables to change during the actual course of the projects and thus deviate from the baseline.
All quantitative project variations are automatically recorded on the Timeline, without the project leader having to manually annotate them.
Recording events on the Project Timeline
So, what is meant by quantitative project variations?
We are specifically talking about changes in delivery dates and in budget; we will see all these changes highlighted on our timeline with a specific icon based on the event.

This is what our Project Timeline looks like.
The icons within it show the times when something in our project was changed, and specifically:
- Date: calendar icon indicates that a project start or end date has been changed. Since the Timeline is also available for project sub-phases, any time changes in these phases will also be visible on their related statistics pages.
- Budget: any budget changes are recorded and shown on the Timeline with the coin icon.
- Update: the small balloon icon instead tells us when a reminder has been manually added about a salient event that occurred on a certain date. Reminders can be added directly from the main page of our projects, in the section dedicated to updates
Free scrolling of the Project Timeline
But of course it is also possible to drag our cursor on the Timeline, to view the progress of the project over time.
As we scroll we will see the percentages of work done changing, along with all the other data shown in the graphs on the Statistics page.
We will be able to move back to any time point in our project, to monitor progress at a certain date or simply see what and how it has changed from the baseline.
An extra monitoring tool: the Project Snapshot
But there is a tool that complements and collaborates with our Project Timeline: the function that lets you take a Snapshot of the current state.
This will allow us to check this state easier at a later date.
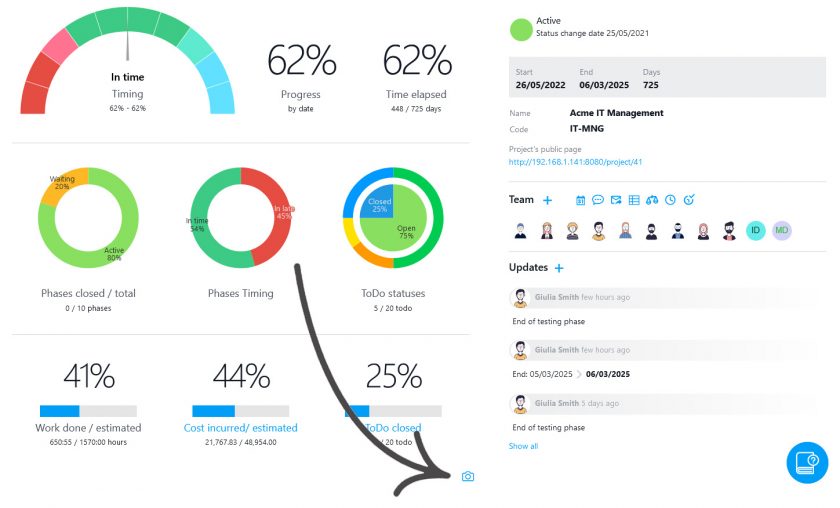
On the Overview page of the project or of one of its phases, you will find the small camera icon.
With this you can ‘take a picture’ of the situation at any time and then display it clearly on the Timeline.
After you have captured the moment, you can write a note to link to this Snapshot: e.g. a time reference, a turning point in the progress of the project, or any other relevant aspect.
You will also find your snapshot icon among those in the Timeline; you can simply click on it to see the status of the project at the saved date.
This step is very useful in the case of long-term projects.
In fact, it will prevent you from scrolling through your Timeline randomly in the future, instead allowing you to have the most interesting moments already highlighted.
Bottom line
We have seen how important it is to keep track of a project’s progress over time, and Twproject offers you a unique tool to perform this analysis.
This is useful both for accurate reporting, but also for making more reliable future forecasts on similar projects.
In the seventh edition of the PMBOK, the project work performance domain is discussed.
This domain defines the basic principles for project process management.
These include the need to constantly monitor changes that may affect the project.
With Twproject’s Timeline, this is done in an agile way. You can ensure that every change is followed by appropriate adjustments.
Furthermore, you can use this data for better planning on future projects.
To start keeping track of all events related to your projects right away, try Twproject free for 15 days. Our support team is at your disposal!