
Monitoring actual costs compared to planned costs is one of the most crucial tasks for any project manager. Financial control is more than just numbers: it is what makes projects sustainable, predictable, and capable of generating real value for the business.
Without a clear system for comparing estimates, actual expenses, variations, and trends, even the most polished project can go off track.
In this article, we will examine what monitoring costs really mean, how to calculate costs coherently, which tools and metrics to use, and how a project management platform such as Twproject can make everything easier and more manageable.
INDICE
- Why monitoring actual and planned costs is key
- What are planned costs and actual costs
- How to calculate actual costs accurately
- Key metrics for monitoring actual costs
- How to continuously monitor actual and planned costs
- Advanced dashboards: a snapshot of the financial status
- Recurrent reports: control routines that enable you to anticipate problems
- Cause analysis: understanding the why before the how
- Plan revision: adapt your project without losing control
- How Twproject makes it easier to monitor actual costs
Why monitoring actual and planned costs is key
Every project begins with a financial plan that specifies resources, schedules, and estimated budgets. The initial plan, however, is always hypothetical: reality brings unexpected variables, additional activities, delays, scope changes, quality issues, or new dependencies.
Monitoring actual costs allows you to:
- Identify budget deviations in a timely manner.
- Understand whether planned activities are progressing as expected.
- Analyze inefficiencies, waste, and scope revisions.
- Have a sound basis for project forecasting.
- Make financial communication with stakeholders and management easier.
Without continuous comparison between estimates and actual costs, there is a risk of budget overruns when it is too late to correct course.
What are planned costs and actual costs
Before understanding how to monitor them, we need to get the definitions straight:
- Planned Costs: Costs budgeted in the project plan. They can include estimated hours, materials, services, purchases, and indirect costs. They’re calculated before execution and constitute the financial baseline.
- Actual Costs: The costs actually recorded during the project, including hours worked, materials purchased, out-of-pocket expenses, consulting costs, external suppliers, licenses, maintenance, etc. Sometimes the difference between planned and actual costs can be pretty significant, but monitoring them helps you anticipate problems and prevent delays or budget overruns.
How to calculate actual costs accurately
A common mistake is to track costs only at the end of the project or in a fragmented fashion. To be of use, this process must be continuous, systematic, and consistent.
Here’s how to accurately calculate actual costs:
1. Track hours worked accurately
Team hours are often the main cost element. Without reliable time tracking, any estimate will be distorted.
Tools such as Twproject allow you to associate an hourly cost with the hours recorded by team members, updating costs in real time.
2. Record all out-of-pocket expenses
Materials, travel, rentals, tools, suppliers: every item must be tracked and categorized. Late recording misrepresents cost trends.
3. Update costs for external resources and consultants
If external professionals are working on your project, you need to record their costs through invoices, contracts, or work orders.
4. Keep your cost baseline aligned
Your budget should only be updated with formal approval. It should not be changed to “make the numbers add up,” otherwise, you lose the value of the comparison.
5. Automate where possible
Automation minimizes manual errors and ensures consistency. Software such as Twproject allows you to calculate the differences between planned and actual costs automatically.
Key metrics for monitoring actual costs
For effective monitoring, collecting data is not enough: you need to know how to interpret it. The most helpful metrics and financial indicators are:
● Cost Variance (CV)
It shows the financial difference between what was planned and what was actually spent.
CV = Budgeted Cost – Actual Cost
A negative value denotes that the project is spending more than planned.
● Cost Performance Index (CPI)
It is an indicator of financial efficiency.
CPI = Budgeted Cost of Work Performed / Actual Cost
A CPI < 1 indicates inefficiency.
● Estimate at Completion (EAC)
It is a forecast of the total cost at the end of the project, based on trends.
It helps you understand in advance if your budget will be exceeded.
● Planned Value vs Actual Cost
Comparing planned value and actual value provides a snapshot of your project’s financial soundness.
How to continuously monitor actual and planned costs
Once cost data has been collected and consolidated, its true value lies in the project manager’s ability to continuously interpret it, not just retrospectively.
Effective monitoring is a cyclical process comprising visual analysis, structured review, and understanding of root causes. Let’s take a closer look at each step.
Advanced dashboards: a snapshot of the financial status
Dashboards are the most powerful tool for swiftly estimating the difference between planned and actual costs.
A well-designed dashboard should include:
- Trend charts showing cost trends over time, highlighting discontinuities or abnormal accelerations.
- Variance tables between planned and actual costs, with critical values highlighted in color.
- Summary indicators such as CV (Cost Variance), CPI (Cost Performance Index), and EAC (Estimate at Completion).
- Baseline vs. current comparison to understand how the project’s financial estimate has changed over time.
In software such as Twproject, this means having a dashboard that automatically updates whenever hours, expenses, or supplier costs are recorded. The benefit? A real-time snapshot of your project, without the need for complex manual work.
Recurrent reports: control routines that enable you to anticipate problems
Relying solely on dashboards is not enough: you need discipline. Weekly reviews or progress meetings serve this purpose precisely: to consolidate monitoring.
A sound, recurrent report should include:
- Analysis of the most significant variances over the week.
- Evidence of activities that have generated significant cost variations.
- Updated forecasts on the remaining budget.
- Emerging financial risk indicators.
- Discussion on corrective actions to be taken.
This approach turns cost control into a collaborative activity, shared with teams and stakeholders, preventing it from becoming merely an administrative task to be performed “at the end of the month.”
Cause analysis: understanding the why before the how
When a project starts to show deviations, your priority isn’t to fix them, but to figure out what caused them. A quick analysis almost always leads to ineffective solutions.
The most common causes are:
1. Estimation errors: These happen when the first plan is based on incomplete or overly optimistic data. This is usually the case with new, risky, or poorly defined activities.
2. Price increases: Market, inflation, material costs, or suppliers revising their rates: external variables that the PM doesn’t control but must monitor closely.
3. Scope creep: Small “extra” requests can pile up and weigh heavily on budgets. Lack of change management makes this even more dangerous.
4. Operational inefficiencies: Sluggish processes, poor communication, bottlenecks, and duplicated work all add to labor hours and, therefore, costs.
5. Unplanned resources: When people or skills are added without adjusting budgets, actual costs skyrocket.
This often happens during critical phases or when projects are delayed.
A thorough analysis should include a root cause analysis, for example, using techniques such as the 5 Whys or Ishikawa diagrams.
Plan revision: adapt your project without losing control
If root cause analysis confirms that your project has changed significantly, then it’s time to revise your budget.
This is how you should proceed:
- Report the deviation transparently to stakeholders.
- Explain the causes with data, reports, and dashboards.
- Define alternative scenarios (corrective measures, optimizations, resource reallocation).
- Lay down a new baseline formally approved.
- Update your tools to integrate the new forecast into your system.
Twproject supports this phase through baseline management, plan versioning, and clear visualization of cost evolution over time.
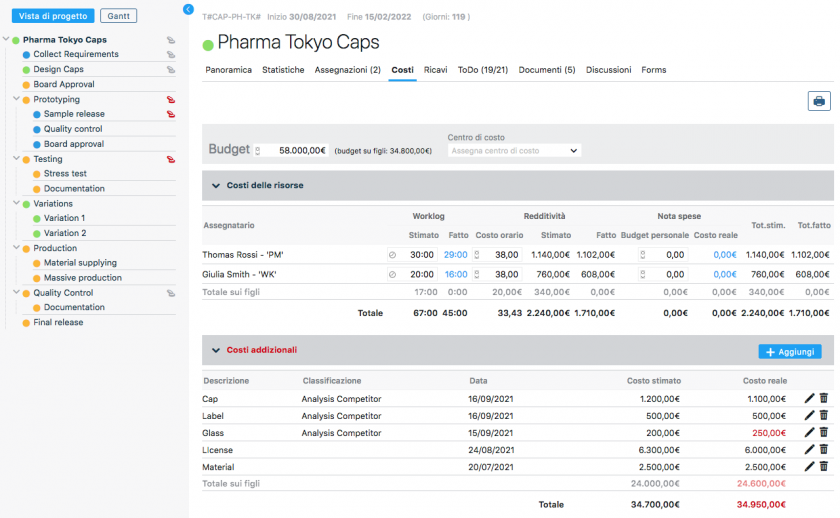
How Twproject makes it easier to monitor actual costs
Twproject is a platform designed to simplify a complex task suchas cost control. Without sounding salesy, several features help project managers that are worth highlighting:
- Integrated and immediate time tracking automatically linked to hourly costs.
- Recording of expenses, materials, and suppliers directly on the project.
- Cost dashboard updated in real time with clear deviations.
- Extensive financial reports that can be exported and easily shared with stakeholders.
- Option to compare baselines, planned costs, and actual costs incurred in a single view.
- Financial forecasts based on actual project trends.
The result is more informed, transparent, and, above all, proactive management: You don’t just find out about overshoots, you prevent them.
By using an unambiguous method to analyze and calculate costs, record actual expenses, and constantly analyze deviations, project managers gain a realistic and reliable insight into the status of their projects.
If you really want to keep your project budgets in check, consistent monitoring and the quality of the tools you use make all the difference.