
Standard deviation is an abstract construct based on observation rather than computation or experimentation.
The standard deviation, also represented by the Greek letter sigma σ, is a metric used to express the amount of variation or dispersion in a group of data.
In other words, it defines how much the members of a data group differ from the average value of the group itself.
CONTENT
A low figure for the standard deviation means that the data tends to be close to the average or expected value of the set, while a high figure means that the data is spread over a wider range.
The standard deviation and “normal distribution” concept is part of the general principle of probability on which the past can be relied upon to predict the future.
Obviously what will happen precisely is unknown but in many situations what happened in the past can be valuable to predict the future.
The main question is thus: to what extent can one rely on past models to predict the future?
Standard deviation applications
Odds study began in 1654 when French mathematicians Blaise Pascal and Pierre de Fermat solved an enigma that troubled gamblers for more than 200 years: how to split the prize in the case of unfinished gambling if one of the players is in advantage?
Their solution meant that people could, for the first time in history, make decisions and predict the future based on numbers.
In the following century, mathematicians developed quantitative risk management techniques that transformed probability theory into a powerful tool to organize, interpret and apply information to help make decisions for the future.
The concepts of standard deviation and “normal distribution” thus began to be the focus of these new developments and studies.
In 1730 Abraham de Moivre suggested the shape of a normal distribution, the so-called “bell curve”.
Later on, Carl Friedrich Gauss confirmed de Moivre’s bell curve and elaborated the mathematics necessary to apply this probabilistic concept to risk.
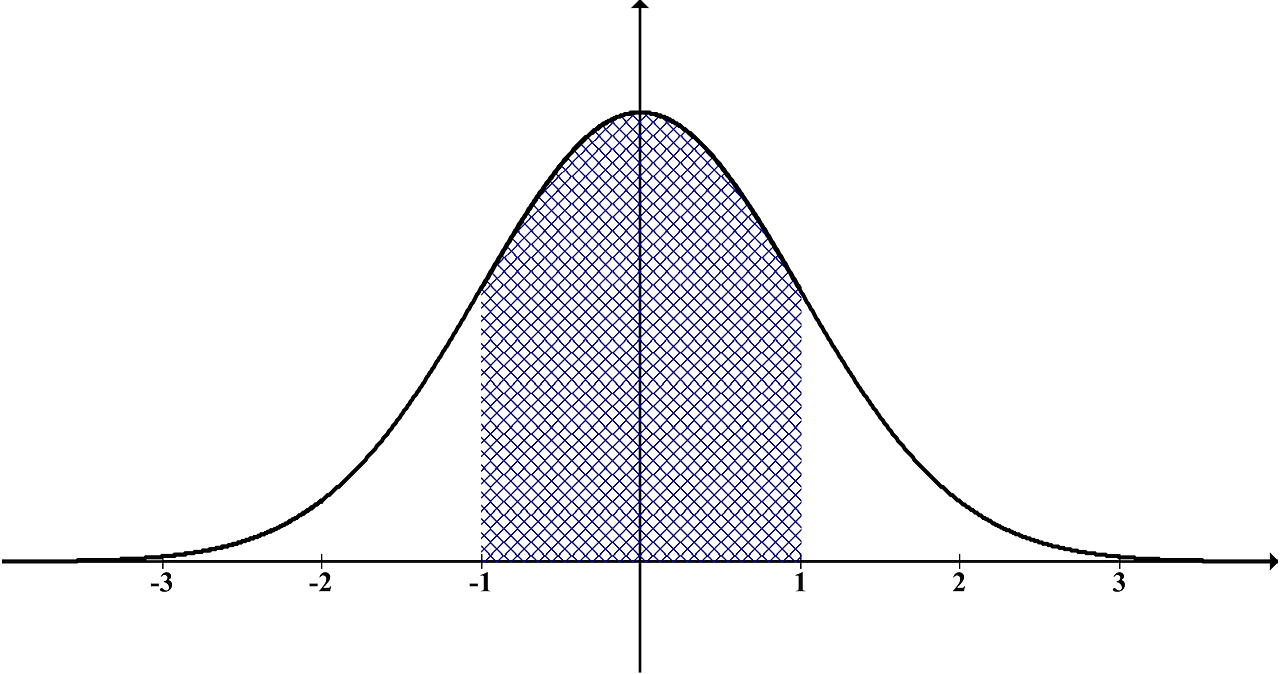
A normal variation can be large or small depending on the population, or data group, that is being studied and the normal distribution curve defined by its standard deviation provides tools to help understand the likely range of results that can be expected.
This prediction is clearly never certain, but there is a high degree of probability that it is reasonably correct and the degree of certainty increases as the amount of data used in the analysis increases.
How to use deviations in project management
A key factor in understanding the concept of standard deviation is to consider that it was based on the analysis of data obtained from hundreds of measurements.
Therefore, this concept will have less value in determining the one-time consequences on the basis of a single result or a single risk event.
For each set of measured data, the main things to remember are:
- The standard deviation is expressed in the same terms as the measured factor. If the factor to be measured is the age of people’ death, measured in years, the standard deviation will also be measured in years and, again, if the factor to be measured is the length of a bolt expressed in millimeters, the standard deviation will be expressed in millimeters.
- The standard variation value for a specific population is constant, if 1 SD = 0.5 mm, 2 SD = 1 mm and 6 SD = 3 mm, then if the target length for the bolt is 100 mm and also the average length produced is 100 mm, then 99.99% of the bolts produced will range from 97 mm to 103 mm (± 6 SD).
- Percentages for 1 SD, 2 SD, 3 SD and 6 SD are always the same because the value of the standard variation expressed in millimeters, years, etc. varies according to the overall variance of the population and, of course, the measured factor.
How to apply standard deviation to projects?
PMBOK says that you can determine a project standard deviation or activity by applying the following simple formula:
SD (σ) = (P – O) / 6
with P being the pessimistic duration, i.e. when things are really going badly, and O being the optimistic duration, i.e. when things are going very well.
For example, if P = 25 days and O = 10 days, according to PMBOK the SD = (25-10) / 6 = 2,5 days.
This formula, according to PMBOK, implies a symmetric bell curve or a normal (Gaussian) distribution – as explained above – where if durations are considered, the distribution suggests that there is a 50% probability that the project will take less time than the average and a 50% probability that it may take longer.
However, PMBOK looks generic when you consider that a normal distribution is rarely the case for project management durations where a beta frequency distribution is much more common, since there is a limit to the speed at which you can complete a project, but virtually no limit to the time it takes to complete it.
The resultant asymmetric distribution therefore does not possess the characteristics of the normal curve.
According to the previous data, if we applied the formula (P – O) / 6, the standard deviation would be 2.5 days.
However, the true standard deviation for this distribution is 7.81 days, given by the following formula:
SD = √ [(O-E) ² + 4 (M-E) ² + (P-E) ²] / 6, dove E = (O + 4M + P) / 6
D = √ [(10-15) ² + 4 (13,75 -15) ² + (25-15) ²] / 6 = 7,81 days
The three critical numbers in this case are:
- 10, the optimistic time frame
- 13,75 the average between optimistic and pessimistic time frame
- 25, the pessimistic time frame
Why the standard deviation of a project is crucial
Understanding standard deviation means improving the quality of forecasts and increasing the ability to control risks.
Risk management cannot be based solely on perceptions or general estimates: metrics such as standard deviation, variance analysis and PERT estimation provide a statistical basis for decision-making.
When analysing deviations in time, cost or quality, standard deviation becomes a key tool in statistical project control, useful for assessing the actual accuracy of initial estimates and performance variability.
In more complex projects, especially when variability is high, techniques such as Monte Carlo analysis allow you to evaluate different possible project developments, exploring probabilistic scenarios and increasing the ability to identify and mitigate hidden risks.
In this context, software such as Twproject can prove invaluable: thanks to its modules dedicated to monitoring time, costs and workloads, it allows you to collect real data directly from the team’s daily activities. More real data means greater reliability in performance analysis, probability and uncertainty assessment, and in all project forecasts in general.
In practice, Twproject becomes the concrete database on which to apply statistical models that really help you make more informed decisions.
Lastly, the concepts of “standard deviation” and “normal distribution” are precious quality control tools in the event that the project is producing or purchasing hundreds of similar components – like bolts.
They are less precise concepts when dealing with the probability of completing a “one-off” or one-time project.
In both situations an understanding of variability and probability is important, but when faced with the uncertainties of a “one-off” design, the “beta” deviation provides a more reliable approach.