For a project manager, having an immediate and clear view of a project’s progress in percentage terms is critical to making informed and timely decisions.
Indeed, there comes a time in the life of a project in which the PM will find himself having to answer the fateful question: “where are we?”
At the dawn of our activity in this field, many years ago, the main purpose of the PM’s job was primarily the creation of a huge Gantt (the more detailed it was the better), which was punctually printed, or at the time “plotted” and hung in the office behind the PM’s desk.
CONTENT
- Progress data in the project dashboard
- All types of project progress
- 1. Manual progress estimation
- 2. Automatic progress calculation
- 2.1. By worklog done on estimated
- 2.2. By phases (weighed)
- 2.3. By completed phases over totals
- 2.4. By closed ToDo’s over total
- 2.5. By closed ToDo’s (weighted) over total
- 2.6. By encountered costs over estimated or budget
- 2.7. By dates
- Bottom line
Then the project started and ….
Unfortunately, the reality had not been informed on the path traced by the PM and despite good intentions they could be separated.
But here unexpectedly the atrocious aforementioned question fell from above on the head of the unsuspecting PM.
Following days were generally full of excited phone calls, rounds of emails, exchanges of Excel, screams and anxieties to be able to collect data and update the evil Gantt (which was the more detailed and the more difficult to update).
The idea of Twproject was born in that troubled era (we are talking about the distant 2001) precisely to solve this situation.
Twproject was born with the purpose of:
- being a tool for the whole company
- being able to collect information where the activities are carried out, i.e. at the operational level
- providing updated data and management tools to the PM
- presenting aggregate data and statistics for top management
Without the aid of a project management software such as Twproject, the PM, once the data was collected and the Gantt updated, had to make a manual estimate of the project’s progress percentage, the extreme synthesis.
66.6%
We consider it “diabolical” to synthesize an infinite number of parameters in a single figure, but basically this is what is required of us.
Having the project progress percentage means possessing a visual and intuitive indicator that facilitates communication with team members, clients and stakeholders.
In other words, it provides a common, understandable reference point that can be shared during project status meetings.
But to calculate it accurately, how useful can software be to help us assess it, perhaps by offering various viewpoints?
Progress data in the project dashboard
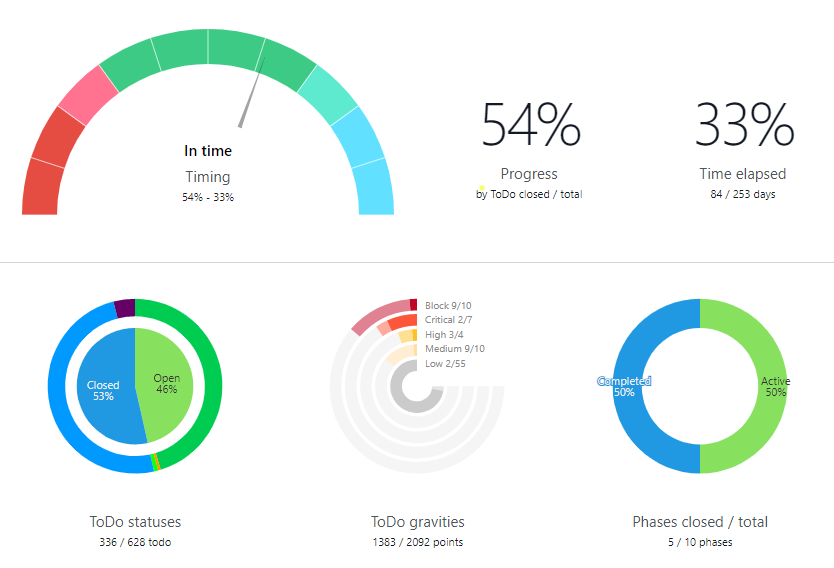
At Twproject, we believe that having this data at hand at all times is very useful, which is why we have placed progress centrally in the project overview.
In fact, seeing the percentage expressed numerically is very useful to have at a glance the health of the project.
We have also included some circular graphs showing the percentage of individual aspects of the project, such as::
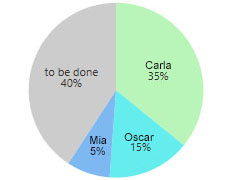
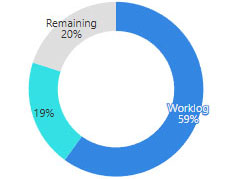
- Work done / estimated: shows the percentages of work done by each team member, compared to what remains to be done according to the schedule.
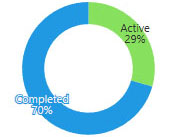
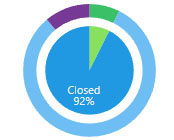
- Phases closed / total: (if applicable, i.e., if there are sub-phases) indicates the percentage of closed or suspended phases to total phases.
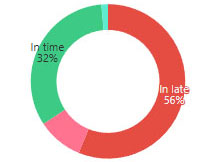
- Phases timing: offers the percentage of project sub-phase timings, which have a range of punctuality.
- ToDo statuses: shows the completion status of the ToDos entered.
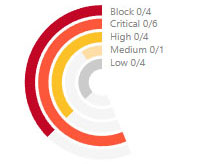
- ToDo gravities: indicates the various levels of urgency of the ToDo currently active on the project.
- Costs incurred / estimated: presents the breakdown of costs by type (additional or from employee labor) compared to what was estimated in the project budget.
These graphs are shown depending on the types of progress you decide to monitor.
In fact, by editing the project data, you can set the progress type with which to indicate the current status of project development.
Let us now see what and how many criteria we can set to monitor the progress of the project.
All types of project progress
Twproject offers several ways to monitor and update the progress of projects, allowing PMs to choose the method that best suits the specific needs of the project.
Here are what they are. With them, you can always have an up-to-date and flexible picture of your projects.
1. Manual progress estimation
In this case, the PM can simply manually update the percentage of completion of the project or individual activities.
As we have seen, Twproject provides you with a view of the main parameters, so that the PM can base their considerations and then manually enter the progress.
Let’s see an example: the data of the development project of Twproject 7.0.007.
Without going into too much detail, the project is managed in Scrum-like mode; we have a backlog where we collect all the ideas, improvements, bugs in the form of ToDo. Sprints, lasting 20 days, represent the Twproject releases.
For each sprint / release we move the ToDo’s that we are going to develop from the Backlog.
This is the structure we currently use:

On each sprint resources (Scrum team) are assigned with the estimated hours to close the ToDo’s.
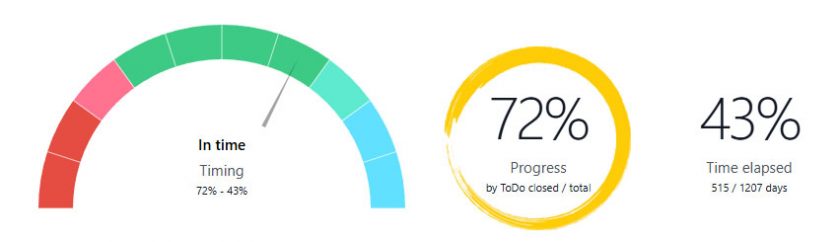
Here is how Twproject summarizes the data useful for determining the progress.
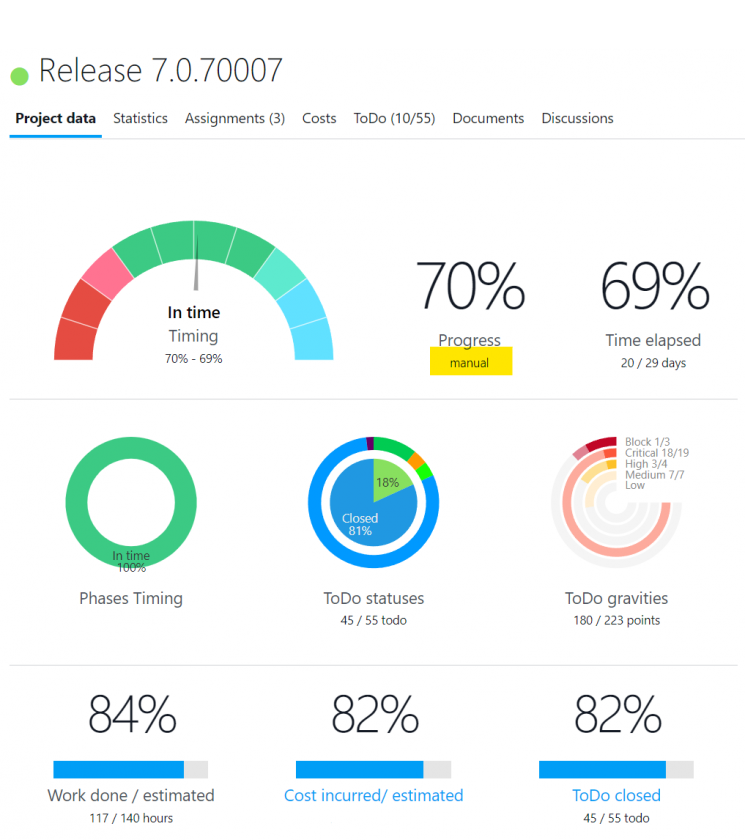
Looking at the figures, we see that 69% of the time has passed for this project, 82% of the to-do’s have been closed, 84% of the hours worked.
Surely a project in good health that could be estimated at 80% of completion.
Leaving this task in the hands of the PM, however, has two negative implications:
- top management does not have this information available in real time and therefore the PM must update the assessment when necessary
- the subjectivity of the assessment is a harbinger of discussions and requests for clarification
2. Automatic progress calculation
To solve these two problems, the solution was to introduce an automatic mechanism for calculating the progress of the project.
To do this, we have identified the most common situations and combined them to allow you to easily model the behavior of even complex projects.

Let’s see in detail the other types of calculation besides the manual one:
2.1. By worklog done on estimated
Twproject can automatically calculate progress based on the actual time recorded versus the planned time.
If one estimated to work 100 hours and worked 45, the progress is 45%.
This is a useful calculation, for example, for a type of work that involves a pay-as-you-go contract or for the budgeting and study phases.
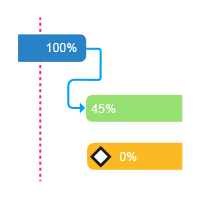
2.2. By phases (weighed)
This is a useful type of calculation for those who rely heavily on WBS, such as manufacturing companies that divide their activities into many stages of the production cycle.
In this case, the progress is calculated based on that of the subphases, weighted on their relevance.
For example, we can have an car manufacturing company that divides the production process into several stages:
- Design (weight: 40%)
- Production of the main components (weight: 30%)
- Final assembly (weight: 20%)
- Quality control (weight: 10%)
Each stage contributes to the overall progress of the project in proportion to its significance. If:
- Design is 100% completed,
- Production of the main components is 50% completed,
- The other two phases have not yet started
Project progress will be calculated as:
(40% × 100%) + (30% × 50%) + (20% × 0%) + (10% × 0%) = 55% completion.
If it seems complicated to assign a percentage of relevance, don’t worry, Twproject levels out all values even if the total does not equal 100.
2.3. By completed phases over totals
In this other case, progress is calculated by the number of closed subprojects compared to the total.
Let’s say the project consists of 3 phases; after finishing the first two we will be at 66%.
A rather brutal calculation, but easy to understand, and that can be useful for projects consisting of many repetitive phases, eg: the installation of 200 identical appliances.
2.4. By closed ToDo’s over total
Here, progress is determined by the number of completed ToDo’s compared to the total.
If we have 100 ToDo’s on the project / phase and we have closed 50, project progress is 50%.
This data is interesting when the project activities can be summarized in ToDo lists.
This calculation is particularly fitting with Agile methodologies.
Check your project progress
with Twproject you can monitor your project progress easily with a complete overview over your statistics.
Try Twproject now!2.5. By closed ToDo’s (weighted) over total
This is a refinement of the previous calculation, but in which the “severity” of the ToDo is considered.
If we have 80 ToDo’s, including 40 “block” ones and 40 “low” ones, and if we close the 40 blockers, we will have a higher advancement than closing the low priority ones.
This working method is a stimulus to induce good practices.
2.6. By encountered costs over estimated or budget
Twproject offers very fine-tuned project cost management, which is why project progress can also be evaluated based on various criteria related to cost trends.
If we have an expenditure (or budget) forecast of 100, and if we have spent 30, project progress is 30%.
This type of data analysis is useful for those working on different types of contracts related to WIP.
It also works for some no-estimate iterative Agile methodologies.
2.7. By dates
Finally, the simplest calculation model, the one for which everything always goes right 😉
If 90% of the expected time has passed, we are at 90%.
Unfortunately, it cannot be applied often in real projects.
Typical is the use in construction in some “waiting” phases such as settling, drying and the like.
However, it is very useful for modeling annual support contracts and similar situations.
Bottom line
Returning to our example of the sprint Twproject 7.0.007, the most suitable automatic formula is the ” ToDo weighed closed over total “, because the sprint is completely determined by the set of ToDo’s that compose it.
If we edit the project and change the type of calculation we will immediately see the effect:

So slightly better than the 80% expected per sensation.
Twproject allows you to use progress calculation rules not only on the project, but also on each phase, sub-phase, and so on.
In this way it will be possible to easily model even complex and heterogeneous behaviors.
For the Twproject 7.0 project we have development partners; in their case we have purchased packages of days and for the progress we use the “done / estimated worklog”

I could therefore have a phase of study progressing with the work done, an Agile development phase progressing by completed ToDo and a maintenance phase progressing by time.
Easy, powerful, intuitive, automatic, objective and above all without too much effort for the PM!
The information relating to the progress is then visible in Twproject not only in the summary lists but also in specific dashboards that high-level users can independently verify without disturbing the team.
In conclusion, these different monitoring modes allow flexible and precise management of project progress, adapting to different working methodologies and specific monitoring needs.
As always, flexibility is everything in Twproject. Try it for free for 14 days is check now how effectively it can simplify your calculations, and your life.


