In production companies, projects cannot wait. A delayed order, an overloaded employee, a cost that exceeds the budget: in short, any problem that is identified too late costs twice as much, in both time and money.
And yet, in many organisations, monitoring is still carried out retrospectively: weekly update meetings, Mixed tools and management systems updated by hand, and emails with attachments that are already out of date by the time they are sent.
CONTENT
- Who really knows what stage the projects are at?
- Progress meetings: from tedious updates to decision-making moments
- The right information for every role: how to set up useful dashboards
- A real-life case study: Defremm S.p.A.
- Would you like to see how this works for the structure of your production projects?
Even if you have data and information, it is scattered, difficult to interpret and available only to those who know where to look for it. As a result, managers make decisions based on incomplete information, and teams work without a clear picture of where the project stands in relation to its objectives.
This results in delays to deliveries but, above all, in a waste of money and resources. What you need is a method of monitoring and management, made possible by a specific tool. Let’s take a look at it together.
Who really knows what stage the projects are at?
If you’re a leader in a manufacturing company, you’ll know full well that complexity is the norm, particularly for the following reasons:
- companies manage several projects in parallel
- resources within projects are spread across different departments, each with their own pace and working hours
- the various stages of production, even when managed by different staff, are interdependent and require an overview
- finally, clients and stakeholders expect to be kept up to date and to be able to monitor the progress of the work.
In this context, the most common risk is not that things will go wrong, but rather that nobody will notice in time. Our recommendation here is to equip yourself with a reliable tool that automates data consolidation and analysis.
Twproject tackles this issue with a system of customisable dashboards — also known as ‘get things done’ — which become each user’s home page when they log in. These are not static reports: they are real-time views, tailored to the specific needs of the user viewing them.
Each role has its own specialised and customisable view. Here are a few examples:
| Role | What they see on their dashboard |
|---|---|
| Project Manager | Team workload and status of projects under management |
| Production Manager | Upcoming milestones and overdue tasks |
| Controller | Actual costs versus budget for each project |
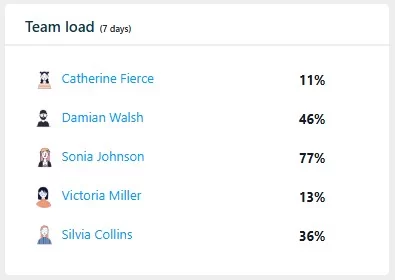
The Project Manager can see their team’s workload and the status of the projects they are managing. The Production Manager can see upcoming milestones and overdue tasks. The Project Cost Manager can see actual costs against the budget. Everyone can see what they need, without having to switch between different screens or ask colleagues for updates.
Progress meetings: from tedious updates to decision-making moments
How many hours a week are spent in progress meetings to gather updates that might already be available in a system? And how many decisions are postponed because the data isn’t ready, or isn’t up to date, or isn’t in the right format for discussion?
With Twproject’s dashboards, project data is always readily available and updated in real time as team members log their hours, complete tasks and track their progress.
This radically transforms progress meetings: time is no longer spent gathering information, but rather discussing it and making decisions, saving a considerable amount of valuable time.
If, during the meeting, it becomes apparent that a phase needs to be rescheduled or resources need to be reallocated, this can be done directly on the platform, with the changes automatically communicated to the whole team via notifications.
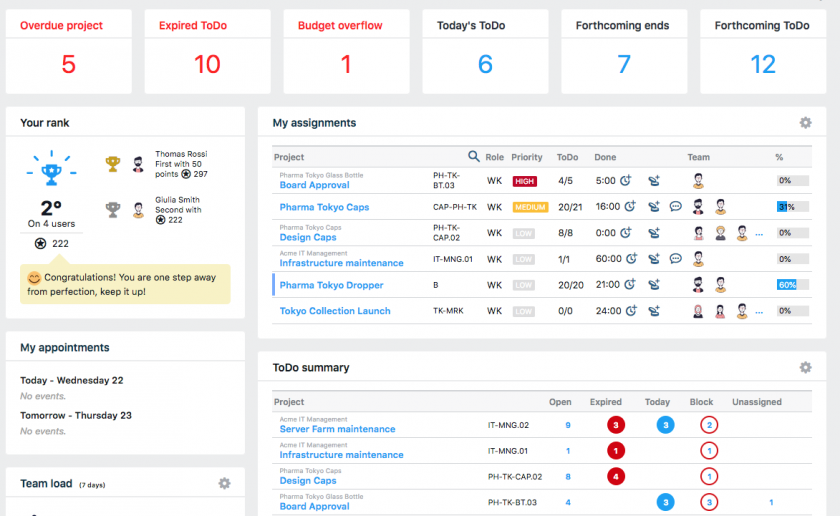
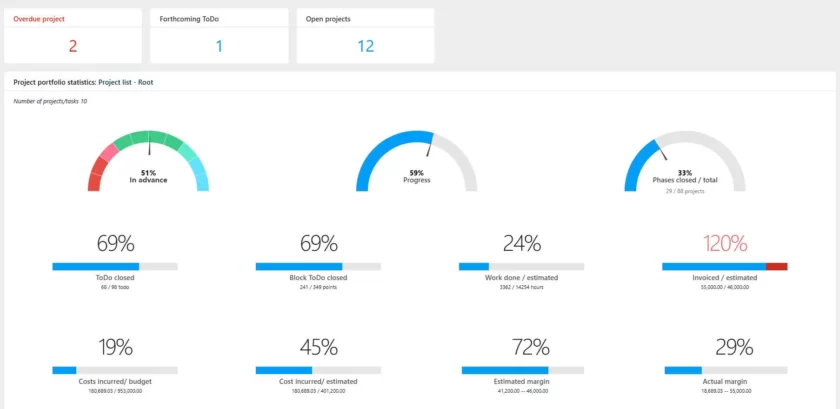
In this case, the Project Manager’s dashboard shows the team’s workload, open projects and a summary of all ongoing tasks at a glance. The dashboard for supervisors and stakeholders includes a widget summarising tasks that are open, nearly complete or overdue — exactly the kind of view you need to run an effective meeting without any elaborate preparation.
The right information for every role: how to set up useful dashboards
A department operator does not need to see the overall budget for the order. A production manager does not need to see the to-do list – that is, the minor tasks – of an individual assembler. Yet, in many systems, everyone sees everything, or nobody sees anything useful.
Twproject allows you to create custom dashboards for each profile. Let’s take a look at a few:
The ‘Get Things Done’ page is designed for those working on operational tasks and displays open projects, assigned to-dos, the calendar and the most recent tasks.
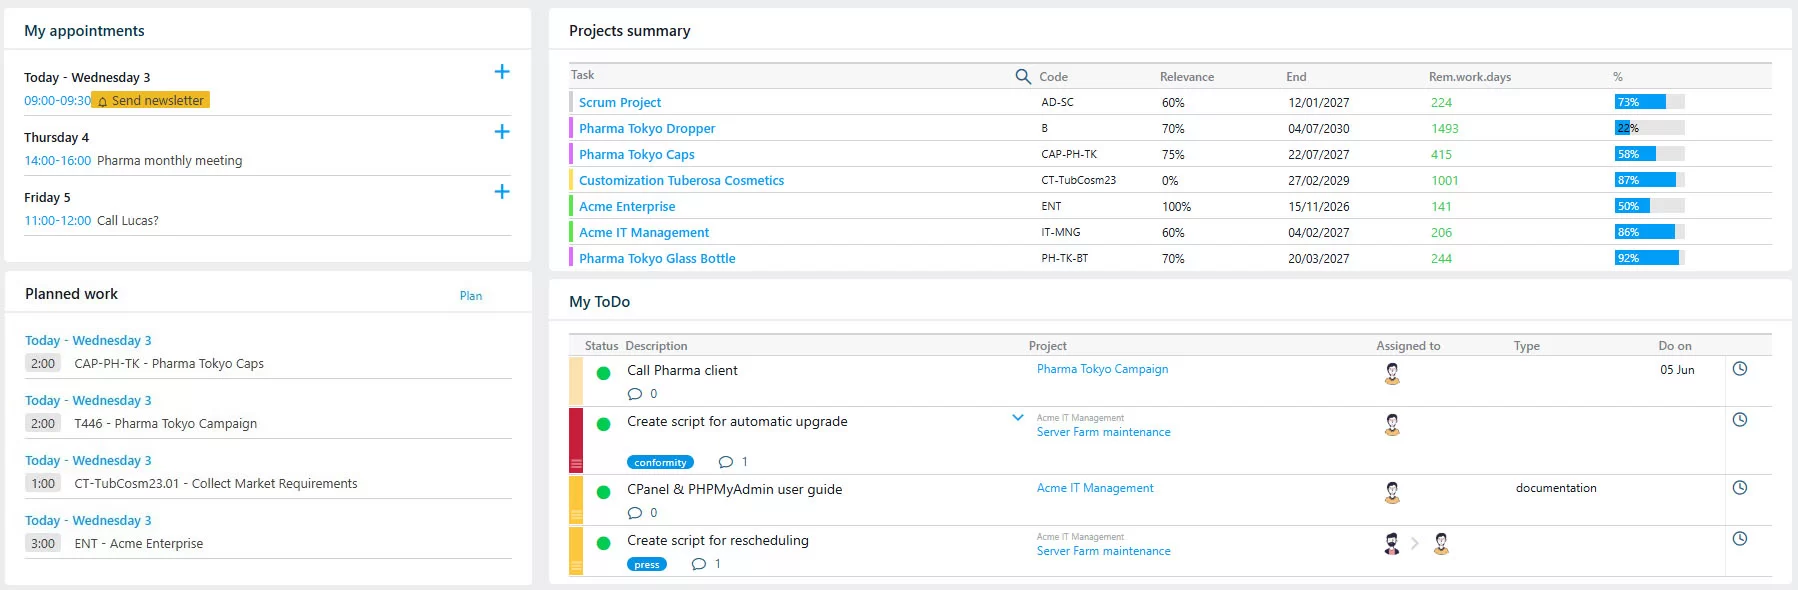
The Project Manager page includes a view of the team’s workload and a summary of tasks across multiple projects.
The Supervisor and Stakeholder page provides an overview of critical tasks, with filters to highlight those that are behind schedule or at risk. This view is essential for those who do not need to know the minute details of projects, but rather need to take a bird’s-eye view of progress and the financial situation, and draw conclusions from it.
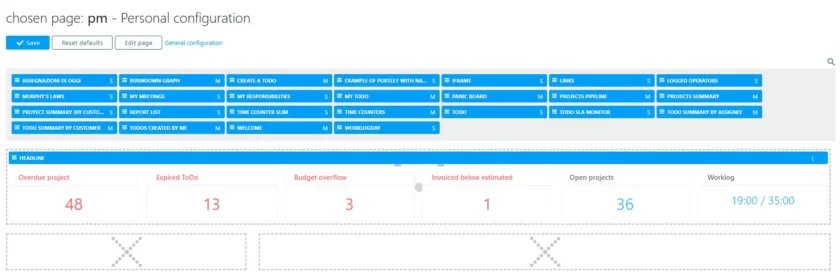
Please note! Each dashboard is customisable: widgets can be added, removed and repositioned according to each user’s preferences. Administrators can also lock certain widgets so that they are visible to everyone, which is useful for ensuring that specific information is always visible regardless of individual customisations. The result is a system where, upon logging in, each person finds exactly the information they need to start working.
A real-life case study: Defremm S.p.A.
Defremm S.p.A. is an Italian production company specialising in the cold forming of steel, aluminium, copper and brass components.
Before adopting Twproject, project management was carried out using Excel spreadsheets (!): the Gantt chart was updated by manually colour-coding the cells, and those involved often forgot to do so. As a result, it was impossible to have clear, up-to-date data, and meetings turned into information-gathering sessions rather than decision-making sessions.
Following the implementation of Twproject, Defremm set up ‘master’ project templates for each type of sampling — predefined structures with assigned personnel and stages already set up, which can be customised in just a few clicks for new orders.
The dashboards made it possible to see at a glance any missed deadlines, upcoming milestones, budget overruns and excessive worklog entries. In the words of Luca Missaglia, Head of the Technical Department and Project Manager:
“Twproject has enabled us to arrive at meetings better prepared in terms of: optimised working times, clear planning, progress updates, key milestones, clear time estimates and balanced resource allocations.”
And yet:
‘As projects evolve, thanks to Twproject, all changes and their implications are available to everyone in real time and can be discussed immediately, enabling us to draw up detailed plans with precision.’
Would you like to see how this works for the structure of your production projects?
To set up the right dashboards, it is important to understand who uses the system, how often they use it, and what decisions they need to make.
Choosing the right tool is key to starting to save time on monitoring activities at all levels of the organisation.
Our expert production tutors can show you how to set up Twproject for your actual organisation: pre-designed dashboards for project managers, department heads and senior management, which can be further customised with the widgets most useful for your specific context.
👉 Book your free, personalised demo now