Flowchart is very important in project management – perhaps fundamental – because it improves work flow efficiency and makes the project transparent.
CONTENT
Lack of transparency is one of the main causes of inefficiency in any project.
Whether it is the lack of a clear domain for particular activities or a path not properly outlined from start to finish, this cloudiness hinders the project flow with unnecessary obstacles.
You can use flowcharts at every stage of a project, from initial planning to final evaluation, to ensure clearer, more efficient management that is shared among all team members.
Let’s take a look at what a flowchart is and why you should use them in projects.
What is a flowchart?
A flowchart not only helps you visualize all types of processes and work flows in a project, but also provides a shared language that improves team orientation.
But there’s more.
By using a flowchart to visually document your project, you can:
- Illustrate the sequence of activities required for its completion
- Highlight possible work flow issues
- Find out about areas where efficiency, quality or performance can be improved
- Show high volumes of information on a single screen thus allowing you to handle large amounts of information
- Assign different color schemes to different activities and processes, easing their interpretation
Also, another good news is that project management flowcharts generally are easy to create.
Each symbol in the flowchart communicates specific actions or decisions. Just use a standardized collection of symbols and shapes of the flowchart to view each step of the project, then connect them with linking arrows indicating the direction of the work flow.
Once completed, the flowchart is ready to help the project manager and team to analyze, edit, and implement specific project plans and objectives.
In other words, a flowchart is a graphical helper, designed to to provide a visual representation of the sequence of steps to follow during the project management process.
There are different types of flowcharts, each designed for different purposes: for example, high-level charts provide a general overview, while most detailed charts can provide step-by-step instructions for specific tasks.
Choosing the right chart template is crucial to ensure that the chart effectively serves its purpose, providing focus and guidance at all organisational levels.
Here are a couple of examples of flow diagrams:
- Hiring process: a flow chart of the hiring process can start with the receipt of a candidate’s CV and follow the steps of selection, interview, assessment and recruitment. This helps HR to maintain a clear and standardised process.
- Manufacturing sector: in a manufacturing context, a flow chart could illustrate the assembly process of a product, from raw material to final quality control. Detailed diagrams can help identify bottlenecks and inefficiencies.
With this guide running, the project team will know what comes next and the process can run as smoothly and efficiently as possible.
Why use a project management process flowchart?
The purpose of any flowchart is to help to visualize the required steps, which is especially useful when managing business processes and projects.
Each diagram includes actions, who is responsible for executing those actions and the inputs and outputs for each step.
Furthermore, in some cases, the flowcharts may also include a record of all project documents and other materials needed to perform the actions.
L’obiettivo del diagramma di flusso è la chiarezza e la trasparenza.
The goal of the flowchart is clarity and transparency.
The wording used must be simple and free of unnecessary or expert jargon; the steps must be clear to everyone, whatever their level of specialization and knowledge.
For the same reason, already at the beginning of the project a consistent agreement must be found on how to “build” a flowchart: for example, a square shape represents a process, a hexagon the end point, a diamond a decision, etc.
Shapes of the chart themselves thus provide information about the stage of the process, and a single glance can tell the reader what kind of operation is taking place at a precise point.
The same applies to colors: these can represent, for example, different resources.
Whatever encoding we agree upon, it will also be necessary to add a legend to the flowchart to identify the meaning of each shape and color, so as to avoid any kind of misunderstanding.
Once the flowchart has mapped the steps in each phase of the project and assigned ownership of responsibilities, everyone can fully understand their role and how they contribute to the whole.

How many types of flowcharts are there?
There are many different types of flowcharts, each designed to effectively represent certain aspects of a process or project. Here are the main ones:
1. Basic (or simple) flowchart
Used to represent the linear sequence of activities or operations in a process. This is the most common type and is suitable for mapping standard procedures.
2. Decision flowchart
Used to visualise the points at which decisions must be made, showing alternative paths depending on the outcome of a choice (e.g. yes/no). It is perfect for processes that involve branching or conditions.
3. Logical flowchart
Highlights the reasoning behind a process, rather than the process itself. It is very useful for analysing complex systems or planning algorithms.
4. Data flow diagram (DFD)
Mainly used in computer science and software engineering, it represents the flow of data within a system, indicating inputs, outputs, storage and transformations.
5. Functional (or cross-functional) flowchart
This divides the diagram into swimlanes, each associated with a department or role. This type is perfect for representing business processes involving multiple functions or departments.
6. Process flow diagram (PFD)
Widely used in industry and manufacturing, this shows the physical and chemical steps of a production process. It is useful for engineers and technicians.
7. Workflow diagram
Describes the activities and their order of execution within a workflow. It is used to improve the management of operational activities.
How to draw a flowchart
The first step is to think about all the different steps of a process.
It is a great idea to engage the whole team in this phase, as everyone can provide valuable input.
Second, you will think about the flow from one step to another:
- Are there any points where the path can split?
- What happens if an activity fails one of the steps, where is it postponed and how are the following activities managed?
- How to handle returns or bifurcations?
These are just some of the questions you will have to ask yourself in this step.
Next, you will assign property of each step. This is particularly important for audit or review phases that can only be performed by a single role or decision maker.
Lastly, you should make sure that your flowchart is consistent and easy to understand, perhaps asking for feedback before making it official.
Ultimately, the benefit of flowcharts is that they show the activities of a project, including decision points, parallel paths, branching loops, and the overall sequence of processing by mapping operational details.
A basic flowchart can help a project manager especially during the planning phase.
When you create a flowchart, this shows the method used by the organization to achieve a particular project goal.
This makes it easier for a project manager to go through the process of determining, delegating and planning each task to team members.

Plan, monitor and optimise every phase with Twproject
Twproject is the ideal software for managing business processes efficiently and flexibly.
Try Twproject!How to benefit by using software
If, as we have seen, the flowchart can be simple and intuitive to make, but if we use good project management software the process will be even easier. In fact, the software currently on the market allows the construction of customised flowcharts that can be adapted to the real needs of a project.
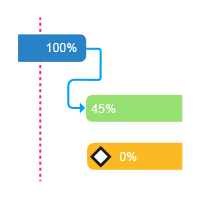
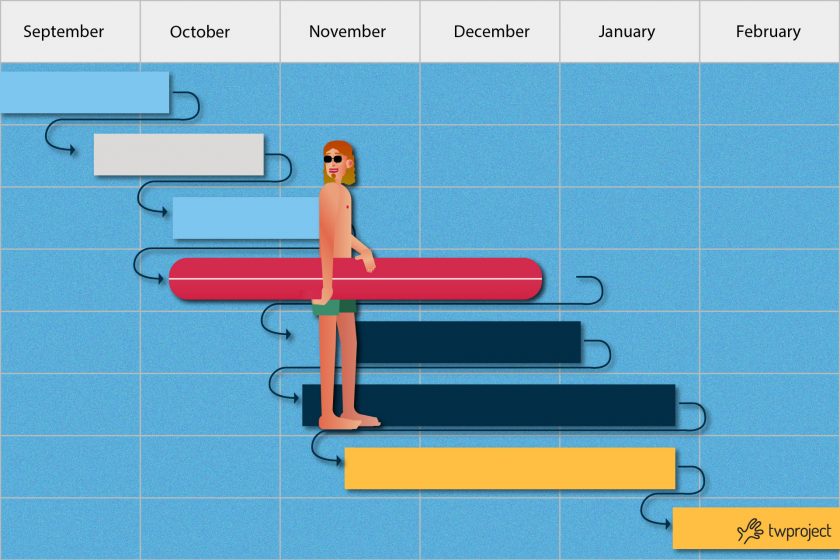
Some state-of-the-art software provides highly elastic and flexible Gantt charts that therefore translate into electronic form what can be initially conceived with pen and paper by the project manager.
Twproject is one such software. Its recent release of an ultra-advanced version of the Gantt diagram enables detailed and flexible project flow analysis, with many tools to optimise processes and avoid mistakes.
It is important to keep in mind, however, that certainly chart and diagrams are incredibly useful tools, but they are still one of the many cogs in what is the most complex project management “machine”.
Strategies such as monitoring project status or adopting a project management methodology are other ways to further improve work processes.
Creating a diagram with the help of software such as Twproject not only speeds up the process, but also provides a clearer and more interactive visual representation of the various operational phases.
Good software can also be used to integrate other essential functions, such as resource management, time planning and the division of responsibilities among team members. This allows you to keep track of the progress of the work at all times and intervene promptly in the event of critical issues.
Every useful tool for project management and execution is present in Twproject. Try its features for 15 days free of charge and we bet you will never go back!


