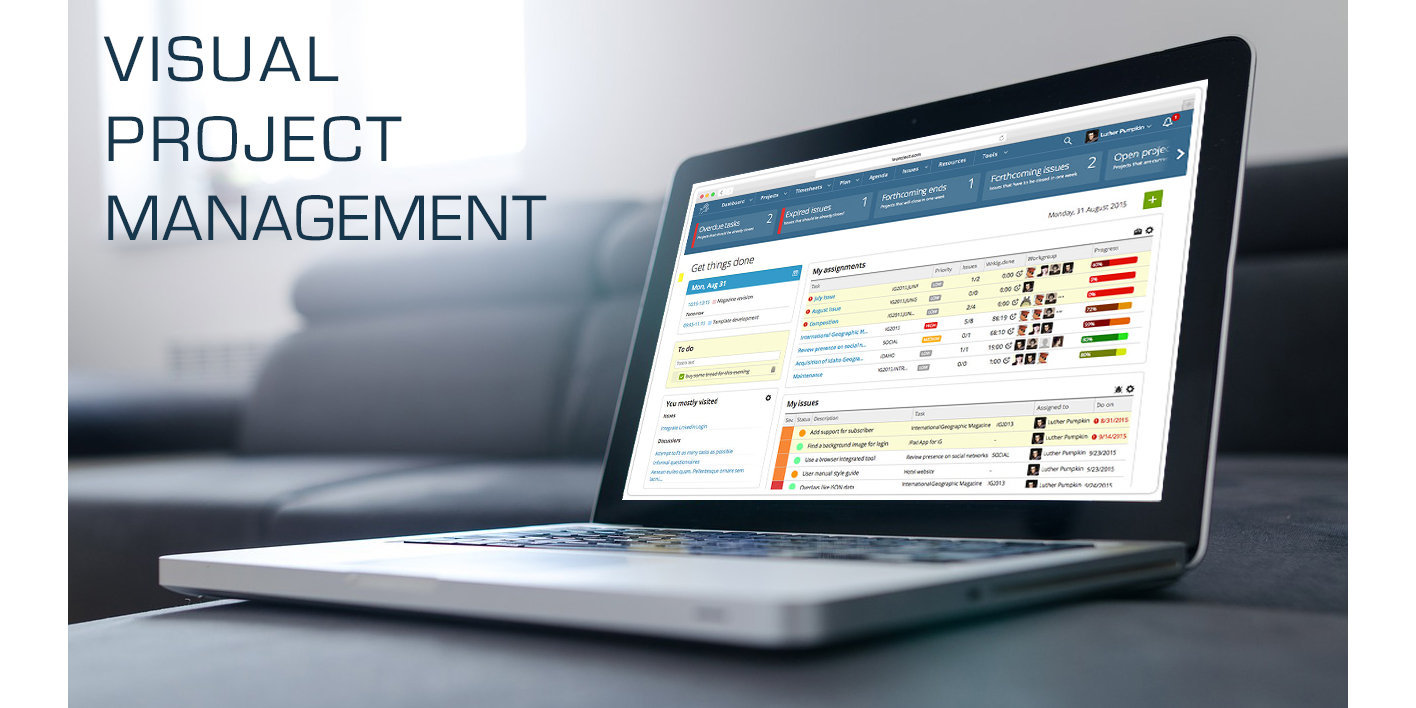
Visual Project Management is an interesting approach to project management. A project management strategy designed to increase success by visualizing project components like data and activities.
It is a proven fact that people receive more than 80% of information through the sense of sight.
From the most tender age, we write and draw in order to visualize our thoughts, emotions and things to remember.
Why not use this way to make work simpler and more efficient? In fact, visualization is something we can implement in project management.
CONTENT INDEX
Visual management of the project
By adopting a visual project management, teams and organizations can complete projects of any kind with more speed and efficiency.
Visual project management therefore becomes a technique for work management.
Instead of listing activities in “to do list” or wasting valuable time tracking information in the mailbox, shared files and spreadsheets, it is much easier to track the work using a visual activity management tool.
Visual functionalities can be a valuable resource for any design style, but are more commonly associated with agile methods like Scrum and Kanban.
In a certain way, Visual Project Management is inspired by the old school blackboard.
The board acts as a roadmap, progress tracker and collaboration tool for all types of development teams.
This is why in TW project, besides the use of visual tools we have already talked about (such as the gantt chart and issue management), we have created real blackboards.
Physical boards and digital boards for visual management
Physical whiteboards are a common way to share information, for example to gather topics for a meeting. In Twproject, we find the “digital twins” of physical boards.
A blackboard is an “open space” where everyone (almost everyone, security is always in the background) can insert a message.
Here’s what a used blackboard looks like.
At any time during a project, hundreds of single data are manipulated, transformed and communicated.
These data include labor estimates, capital and operating expenses, activity lists, performance metrics, calendars, cost-benefit analysis, risk profiles, trend data, etc.
As business speed increases and the need to focus on increasing numbers of data in order to keep project execution under control, new and innovative tools and techniques are needed to help project managers.
The visualization of complex data and processes has proved invaluable in meeting these needs.
Visual Project Management as a facilitator
Traditional visual tools such as Gantt charts, Kanban cards, process diagrams, project team calendars, stakeholder organization graphs and similar are advantageous in their own way, but they do not tell the collective story of the general state of the project.
Complicating the issue, sponsors and key project stakeholders may no longer have time for long project status reports or weekly briefings.
Decisions must be made at the moment, with any data available.
For this reason, the traditional discipline of project management, that exploits processes and documents approaches in a “heavy” way, is quickly abandoned in favor of more agile methods.
Some studies have also shown that the information presented in text formats is ineffective and inefficient.
The human eye can see visual schems 65,000 times faster on an image with respect to a tabular form.

These facts have therefore led to the creation of a new niche within the project management community known as Visual Project Management.
The Scrum-ban style
Regarding the current methodology, many of the useful visual tools combine the best aspects of Kanban and Scrum to which project teams are accustomed.
Some users have started calling this style “Scrum-ban“.
Common visual features include:
- Real time dashboard
- Timeline
- Graphic reports (Gantt, burndown, ecc.)
- Boards (Kanban)
- Roadmap of the product
The key advantage of this new approach is speed, as critical project information can be produced, replicated and digested in more efficient and effective ways.
The adoption of this new approach also offers further distinct advantages to project managers, team members and, above all, to the most important stakeholders:
- The state of project planning, execution, monitoring and control activities are available in a single view, at a glance and it is easy to understand
- Improve clarity, visibility and understanding of the project’s overall scope and operational plan
- Resource allocations, or over-allocations, through the project or multiple projects, are clearly visible.
- As a consequence from the previous point: better planning and allocation of resources
- The impacts of changes to the scope, plan, priority or resources are available in real time
- The information is provided in such a manner that everyone can access it, at any time, place and convenient way
- Ability to isolate problem areas faster
Accelerate processes with Visual Project Management
Visual Project Management can accelerate progress by sharing project information in real time in such a way that is easier to access, understand and transmit.
Today’s project manager has much more to manage than just the project scope, deliverables, communications and teams.
The visual management of the project is not really a radically new approach that messes up the discipline.
It is just a set of tools and techniques that reinforce what we already know: people work and manage projects more efficiently when they have a clear vision of how the project components move and connect with each other.
The best way to represent and share this information in real time is not with a spreadsheet or series of emails, but an image.
Have you adopted visual project management in your work too? Tell us about your experience.


