What is a Gantt Chart? Why it can be useful to manage your project?
If you have never heard of it, it’s important to know that Gantt diagram is a very versatile tool to visualize and track the timing and progress of a task.
CONTENT
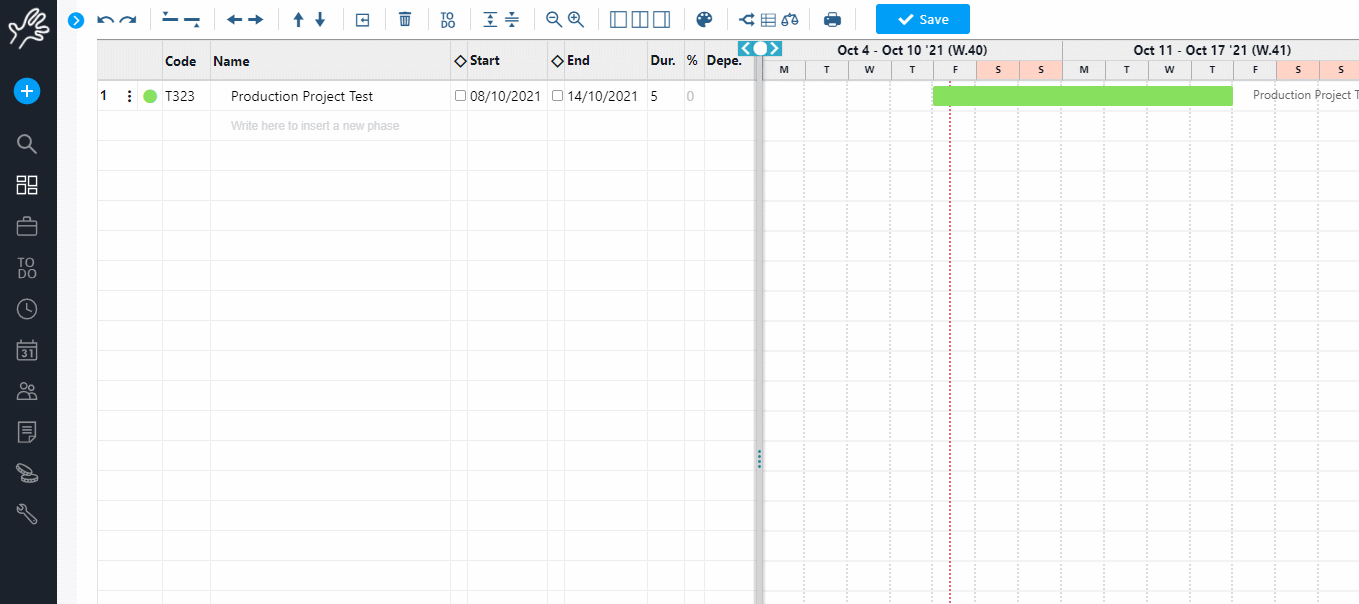
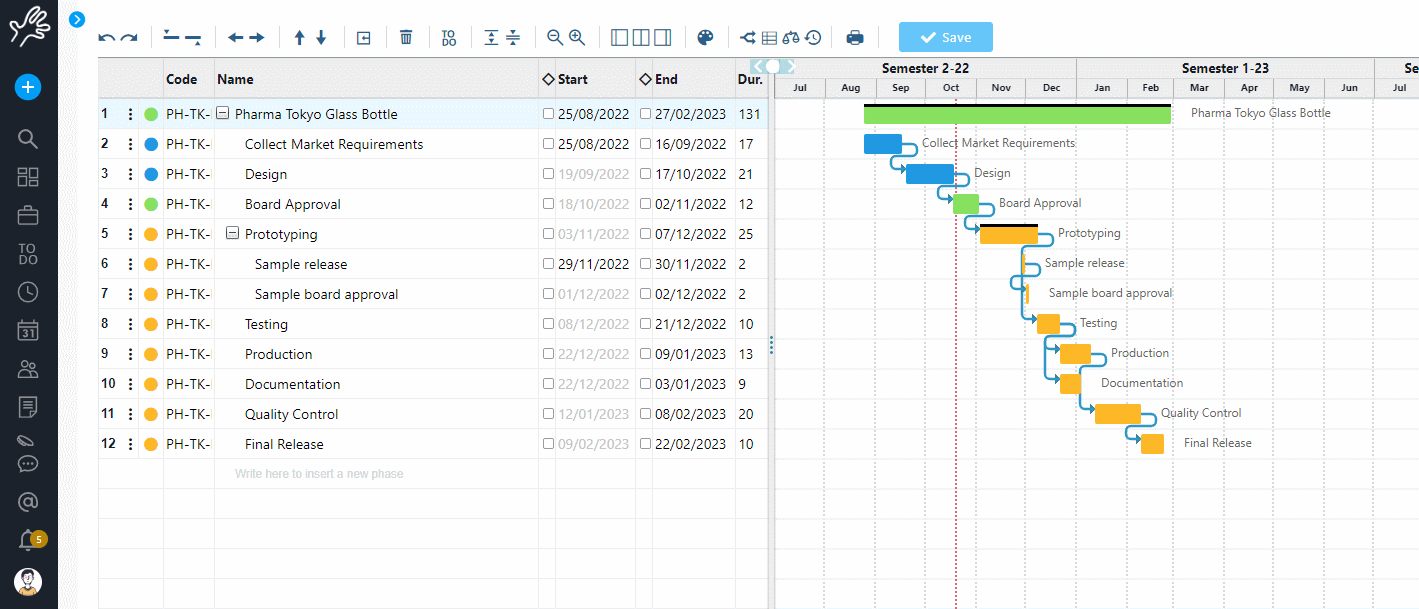
Its representation is very simple: it is a Cartesian diagram, on abscissa you find the time scale from the beginning to the end of the project, while in the ordinate there are all the activities to complete it.
The planned time to perform a task is visually represented with a colored bar that runs from the start date to the end date of the task.
What is the purpose of the Gantt chart?
Managing projects with Gantt diagrams allows you to see at a glance the set of activities to be performed, which have closer deadlines, which can be done at the same time, and the entire dependencies grid.
They are universally used to plan and manage all types of jobs, from complex ones to simple personal ones, thanks to their immediate comprehension.
Let us look at the advantages of using Gantt.
With Gantt you can easily see:
- The start and end date of a project
- What is the sequence of tasks to be done
- Who is working on the various tasks
- How long each task will last
- The dependencies between the various tasks
Below we explain how you can use them to manage your work project.
4 reasons to use Gantt diagrams:
1) Understand your project better
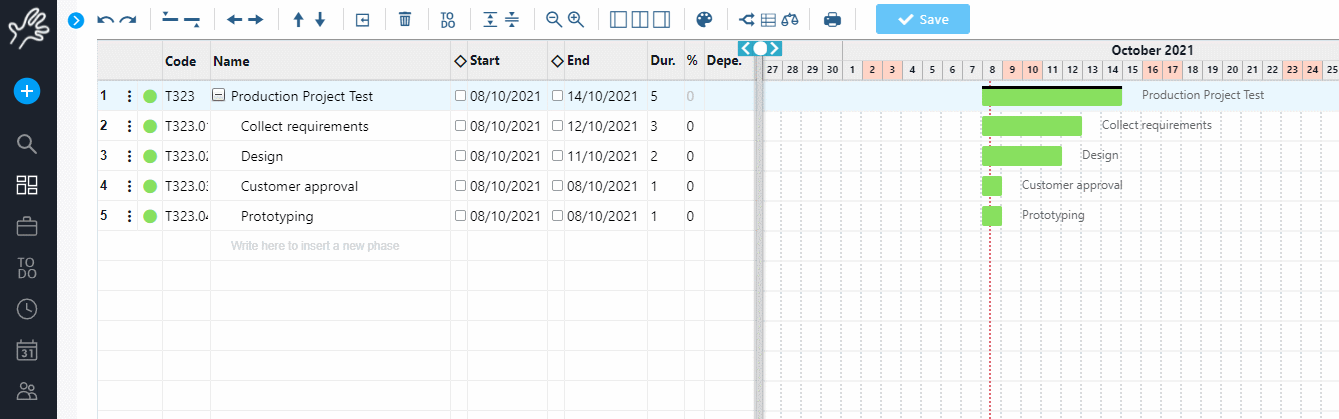
With the creation of the timeline, you and your team will have to highlight and break your project into phases and sub-phases.
This brainstorming will help you classify the entire work plan more accurately, highlighting more clearly the deadlines, the dependencies between the various steps, and also which figures will complete the various tasks.
This analysis is a key point in project planning and the Gantts will help you visualize it more clearly.
The first step is to create a work breakdown structure within which you can enter phases and sub-phases.
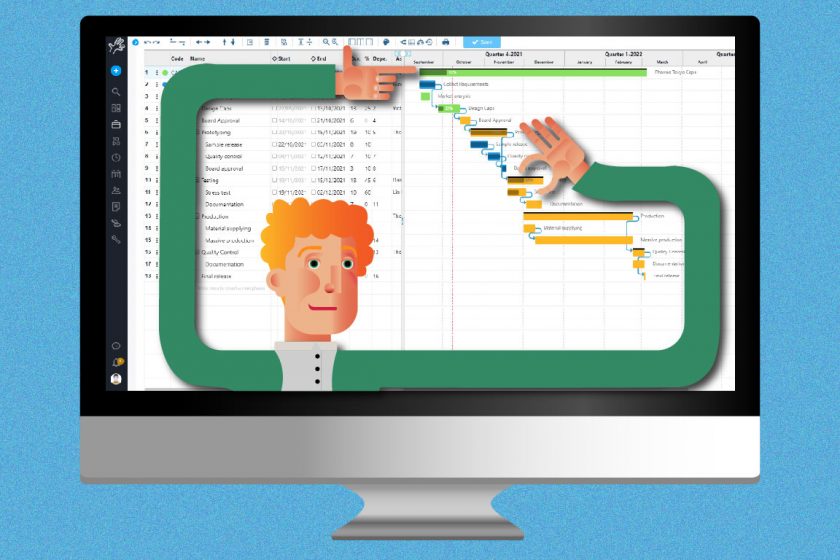
For simple projects, you can use a Excel spreadsheet, for the most complex ones, always in the interest of optimizing time and resources, you can use a project management software like Twproject, that allows you to quickly and easily set up various activities.
2) Define dependencies and deadlines
As mentioned in the previous paragraph, once the phases and sub-phases are identified with their duration, it will be much easier to set milestones and their dependencies.
Once you create these links you will be able to easily understand what impact can have a delayed task to a specific stage.
Being aware of this information at the beginning of the project, exposing what is called “critical path” (the sequence of dependent tasks that determine the end date), will allow you to pay more attention during its course.
3) Delegate project activities
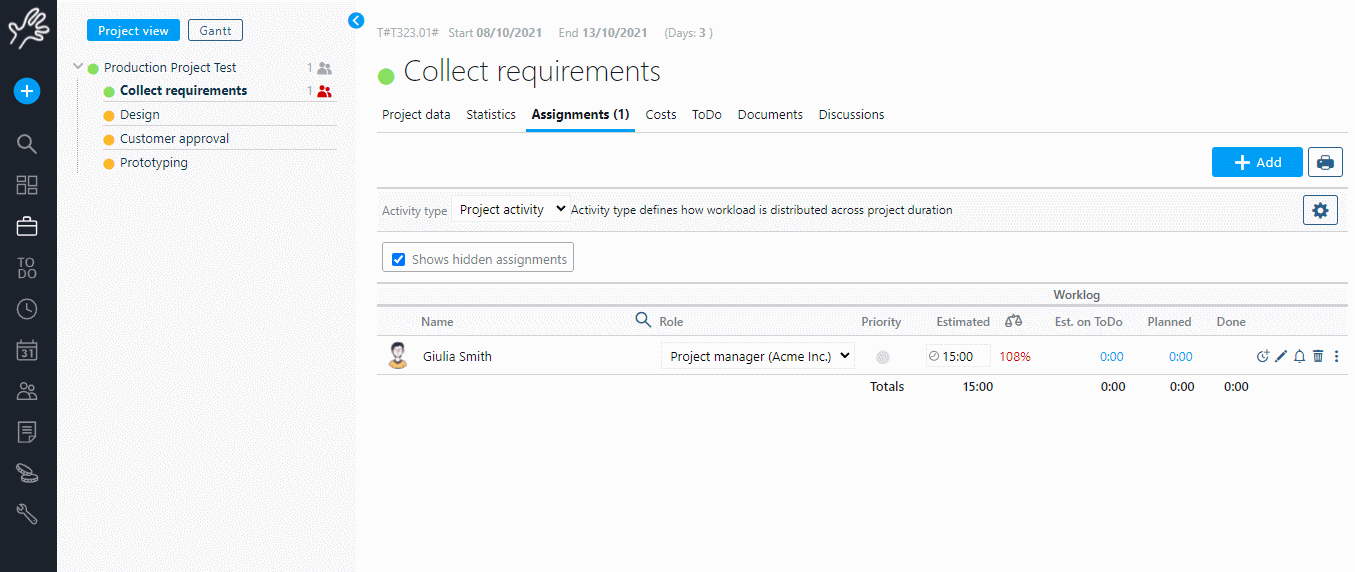
Identifying sub-phases will also help you figuring out which resources are going to accomplish them and so properly distribute your resource work load by improving human resource management.
Establishing the timeline will help you manage your project optimally, balancing your entire workload and avoiding overloads that would affect your team’s operational capability.
Moreover, the use of the Gantt is also fundamental in the case of project re-planning, thanks to which, with just a few simple changes, you can change the entire tree and immediately realise possible new overloads.
Rescheduling activities can be even easier by relying on a project management software such as Twproject which offers the possibility of evaluating the load integrated into the project structure in the Gantt.
Twproject allows you to balance the load of resources by finding the earliest possible end date with a complex algorithm.
4) Check your progress
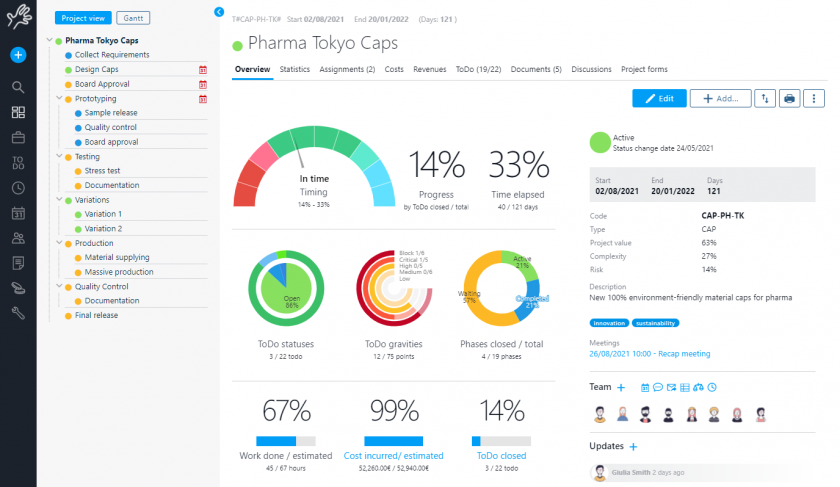
Project Gantt Diagrams, if created with a specific software like Twproject, are dynamic and evolve as a result of completing the various activities.
Thanks to this, you can constantly monitor job development by identifying progress and delays.
Applying Gantt’s diagrams to your project can therefore bring significant benefits:
- Improve analysis and planning
- Reducing errors and risks
- Better resource management
- Greater control
These aspects are crucial for every project manager who seeks to manage the work and the team optimally.
Gantt’s diagrams are, from this point of view, a powerful and immediately applicable tool.
In addition, with a specific tool such as Twproject, you will not only be able to monitor the progress of your project, but you will have the possibility, at any time, to compare the progress of your Gantt with its previous versions up to the baseline.ù
It will be easy to identify the phases that have generated the most delay and thus intervene in future cases.
Workflow optimisation: one more reason to use the Gantt chart
If you want to optimise your workflow and ensure the achievement of your objectives, adopting a Gantt chart proves to be a strategic choice.
This tool not only facilitates the visualisation of the entire project lifecycle, but also enables the precise identification of critical phases and necessary resources.
In a context where every activity must be executed with precision and timing, the Gantt chart provides a clear and immediate overview of the project’s progress. This allows project managers to anticipate any delays or overlaps, ensuring that each phase proceeds on schedule. In addition, the tool’s ability to highlight dependencies between activities helps prevent bottlenecks and manage human and material resources more effectively.
In summary, the Gantt chart is not only a planning tool, but a true ally in optimal project management, essential for those working in the dynamic world of project management.
If you want to deepen your use by simple tests, by decomposing and analyzing your projects you can try Twproject for free, a comprehensive work management tool that includes an interactive tool for creating these diagrams.
Once you’ve downloaded the demo, you can start creating your own charts right away by dividing the job at various stages, assigning them to your employees. Twproject interactive tool will graphically show you the sequence of activities you enter by updating them progressively.
You can do all the tests you need and evaluate in depth the benefits this tool can bring to your work!