A project management software like Twproject, to be really effective, has to be used by all the team, so, how can we valuate if and how much the software is really used?
The question is apparently simple, but it hides some pitfalls.
Twproject is a PM software used by different user profiles: Project managers, Workers, Supervisors just to name the best known ones.
Each of these profiles uses different tools, has different approaches and has specific needs.
For example, when a “worker” accesses Twproject, he wants to know what to work on.
A project manager would like to know how its projects are going.
She/he want to know if the team is working at a sustainable load level or is in trouble.
So, the CEO (supervisor) want an overall view on open / closed projects, their economic values and in monitoring a portfolio of key projects.

Measuring “usage” with a simple login number or connection time counter would be simplistic and ineffective.
Twproject 7 measure the use of the tool as well as the compliance to some good project management practices.
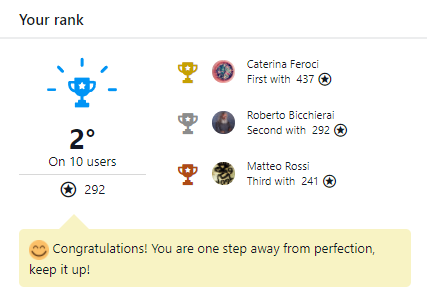
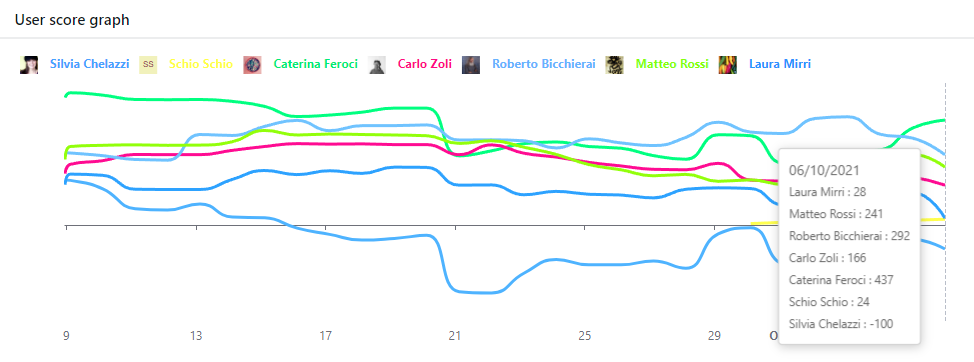
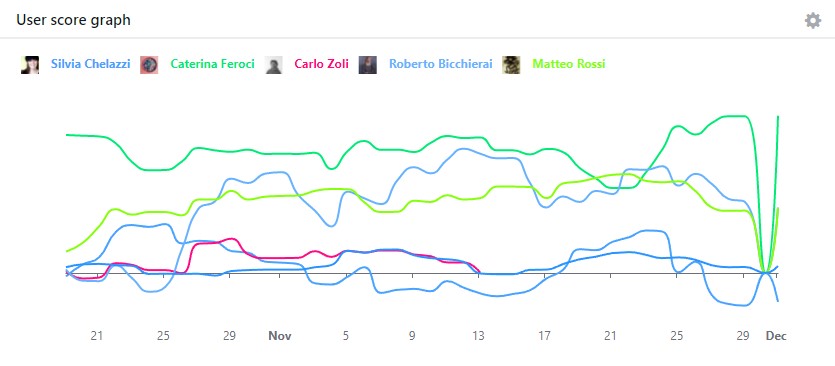
The processing of this complex data is then summarized in two simple “motivational” widgets that show users’ scores.
A healthy “competition” between users will help to better use Twproject and better manage their projects. It is a not negligible aspect.
In this post we will examine in detail how this new tool works.
Data collection
To be able to make statistics you need good data.
I clarify immediately that the collection of this information takes place within the database of your Twproject.
The data is yours and does NOT leave your server. This information serves you, our customers, to know how your users use Twproject and manage their projects, in total respect of privacy.
If this feature is not interesting for you, you can simply disable it.
Daily, Twproject collects, for each user, a series of indicators.
Real time of use of the tool, planned hours, recorded hours and workable hours are basic indicators, not linked to a concept of “quality”.
There are also indicators more related to operations such as the number of todo closed, todo created, chat used etc..
The matching between what planned and what done are more quality oriented. These indicators are valid for all profiles, but are more significant for the operative profiles. Management profiles will find useful expired projects / phases, expired todo, overrun budgets.
UsageHistoryBuilder job carry out this activity .
Score computing
The collected data are processed daily and the user score calculated using a moving average over n days (with n configurable).
Of course, the importance given to each of the parameters described above depends on how your company works.
If it is more “agile”, thus ToDo-oriented, those parameters should have more “weight” than others.
We have therefore made available a tool for configuring these “weights”, here some of those:

The score is calculated as follows:
whoever has made the greatest value for a certain indicator takes the “weight”, whoever has made the smallest value still takes some points. Eg: operator “a” has closed 100 ToDo, “b” has closed 30. Since the “weight” for closed ToDo is 100, “a” will take 100, “b” 30.
Note that some weights are negative, ie they are “penalties”. If I have let the ToDo’s “expire”, or rather I am the operator who has let the most expire, I will have a penalty of 100 points.
Penalties encourages compliance with the project quality indicators, dates, milestones, budgets, estimates, planning.

Tuning weights over time you can incentivize use and good practices depending on which of them you change.
The widgets seen above summarises very well the data. In reality they relies on a collection of information that allows more in-depth analysis.
Technically this task is done by the “UsersScoreBuilder” job.
This tool is meant to be extended and accommodate new “dimensions”, so if you have an idea for some other indicator let us know what you think 🙂


