
How can we create a good Gantt chart and what are the best tools for implementing and managing it?
In this article, we will try to answer this question. We will also try to prove that Gantt charts are not only useful for initial planning, but also for managing ongoing projects.
CONTENT
- What is a Gantt chart used for?
- How to create a Gantt chart?
- 1. Project definition
- 2. Subdivision of the project into activities (WBS – Work Breakdown Structure)
- 3. Setting the duration of activities and milestones
- 4. Identification of dependencies
- 5. Allocation of human resources
- 6. Cost estimation and financial management
- 7. Monitoring and updating
- 8. Communication with stakeholders
- What are the best tools to create Gantt charts?
- 1. Twproject
- 2. Smartsheet
- 3. Trello + Planway
- 4. Toggl Plan
- 5. GanttPRO
- 6. TeamGantt
- Bottom line
How will we do this? Simply by showing you some tools that, in addition to create beautiful Gantt charts, also integrate highly effective project management features.
The main features we will encounter relate to the management of human resources involved in the project and to financial planning.
But now let’s get into the details and see the reasons behind creating a Gantt chart and the best ways and operational tools to do it.
What is a Gantt chart used for?
The Gantt chart is a tool that was developed in the early decades of the 20th century and has undergone numerous changes since then.
From the outset, it was represented as a bar chart for planning project phases.
In the Gantt chart, here is what the two axes represent:
- Horizontal axis: outlines the time frame, which can be divided into days, weeks or months.
- Vertical axis: represents the activities, or phases, into which the project is divided.

In summary, the Gantt chart is the reference point for the temporal allocation of tasks to be carried out for a project.
While initially this was just a chart showing initial activity planning intentions, with the advent of calculation software and later web tools, Gantt charts became an operational tool.
Today, its role does not end with planning, but continues throughout the project’s execution.
How to create a Gantt chart?
So, what are the main steps for creating a Gantt chart that also takes into account possible developments in the project and their implications for the various areas of business management?
Here is a brief list of the main steps.
1. Project definition
- Clearly define the objectives, purpose, and constraints of the project.
- Set an expected start and end date.
- Involve the key stakeholders to gather requirements and expectations.
2. Subdivision of the project into activities (WBS – Work Breakdown Structure)
- Break down the project into phases, then into main activities and finally into sub-activities, thus defining your project tree, or Work Breakdown Structure.
- Each activity must be clear, measurable and have a specific result.
3. Setting the duration of activities and milestones
- Estimate the duration of each activity (in days or weeks), considering realistic times and avoiding overestimates or underestimates.
- Establish milestones, i.e. crucial events or targets planned during the course of the project.
4. Identification of dependencies
- Determine the logical order between activities:
- Finish to Start (FS): a task must finish before another can start.
- Start to Start (SS), Finish to Finish (FF), etc.
- Use arrows or lines to connect dependent activities.
5. Allocation of human resources
- Assign one or more team members to each activity.
Consider:- Staff availability
- Specific skills required
- Sustainable workload
- Plan for any training or hiring if skills are lacking.
📌 Inefficient use of resources can lead to bottlenecks and delays. Use tools that allow you to check the workload of resources.
So far, we have seen the basic features of Gantt charts, which every tool for creating them normally has.
But let’s take a step further and see what additional or desirable features are not native to Gantt charts but add extra value and make a chart set up in this way truly efficient.
We have identified three in particular:
6. Cost estimation and financial management
- Associate each activity with an estimated cost, including:
- Personnel costs
- Material costs
- Overhead and indirect costs
- Prepare an overall budget for the project.
Also include spending milestones (e.g., billing dates, fund disbursements) in the Gantt chart
📌 Integrate Gantt with a cost control tool to compare planned costs and actual costs during the project.
7. Monitoring and updating
- Update the diagram regularly based on actual progress.
- Enter:
- Activity status
- Delays or advances
- Changes in resources
- Compare planned vs. actual.
8. Communication with stakeholders
- Use the diagram for project status meetings.
- Share updated versions with:
- Project team
- Customers
- Management
What are the best tools to create Gantt charts?
The creation of a Gantt chart is therefore a complex process, which begins in the initial planning phase and continues throughout the lifecycle of the project.
The data in the Gantt chart comes from multiple sources and covers different areas of project management.
In fact, along with the increased interactivity of Gantt charts, the range of resources involved in using and consulting the diagram has expanded.
Given that various professionals are involved, we believe that a good Gantt chart creation tool should have the following main features: integration of multiple functions and sharing of operations.
So now let’s move on to the updated ranking of the best tools to create a Gantt chart, keeping in mind the aspects we have highlighted so far, and see which ones help us do our job better.
1. Twproject
Twproject is a tool designed to create a customisable and dynamic Gantt chart that tracks project progress and helps streamline operations.
Considered by many to be the best Gantt chart on the market, Twproject has made this tool its flagship product.
The Gantt features that can be created with Twproject range from the ability to optimise resource workload and easily identify bottlenecks, to planning project costs, to managing micro-tasks (ToDo’s) associated with each phase.
The ability to set dependencies between phases in a very flexible and adaptable manner ensures that the system can be tailored to any business environment and, in particular, to meet the needs of accurate planning.
The Gantt chart created with Twproject is an operational tool that can be updated at any time and keeps track of all changes made over time, comparing them with the initial plan.
Finally, it offers numerous sharing options, both through reports and real-time updates, which are useful during project meetings to keep teams and stakeholders up to date.
Key features:
- Multiple creation modes: via WBS or directly on the diagram, by dragging and dropping blocks;
- Overview or detailed view: different levels of detail and the ability to zoom in on individual phases;
- Resource allocation: setting phase assignees with a real-time view of the workload;
- Overload resolution: automation that allows you to optimise timing based on resource availability;
- Critical path: algorithm for displaying crucial nodes in project development;
- Timeline: history of changes made to the Gantt chart throughout the project lifecycle;
- Dependency types: Finish to Start, Finish to Finish, Start to Start, Start to Finish;
- Flexibility: possibility of having dependencies between non-sequential phases;
- To-do view: integrated display of open and closed project activities for each project phase;
- Financial data view: display of budget and estimated and actual costs for each phase;
- Role and permission management: possibility of assigning the planning of various phases to different users;
- Sharing: exportability in various formats and with optional data integration.
Price: starting from €4.89 user/month.
Pros: it is possible to create a Gantt chart in just a few clicks and integrate the information entered with all other software management tools. Its Gantt chart adapts to any way of working and helps keep the project team aligned at all times.
Cons: no cons to highlight.
360° planning thanks to a useful tool for the daily operations of structured project management.
2. Smartsheet
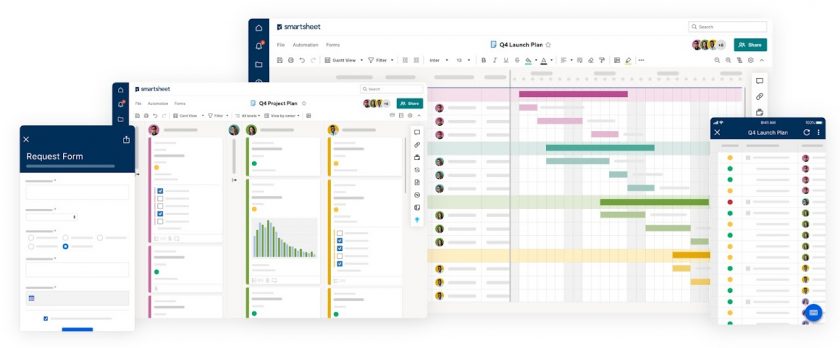
Smartsheet was created as an advanced alternative to traditional Excel spreadsheets, incorporating many of their features but tailoring them to business management. Its goal is to offer a more flexible and collaborative solution compared to traditional calculation tools.
The software combines several components into a single platform, integrating advanced project management features. These include tools for planning, task assignment and activity monitoring, designed to support complex teams and organisations.
Once the data has been entered, it can be viewed in various ways, including the Gantt view, which is useful for tracking the progress of projects over time. However, to take full advantage of its potential, you need to be familiar with formulas and calculation logic.
Key features:
- Customisation of phase colours;
- Conditional formatting that allows you to set custom rules for viewing phases;
- Zoom levels: quarter – month – week – day;
- Secondary views: list, calendar and board;
- Critical path;
- Percentage of work completed shown on the phase;
- Task duration: only shown when dependencies are activated.
Price: starting from $9 user/month, for up to 10 users.
Pros: wide range of project management features, Excel-like interface, which makes it easy to adopt for those accustomed to spreadsheets.
Cons: requires a good level of expertise, especially for advanced use of formulas and features.
Technical tool with advanced features, but quite complex for beginners.
3. Trello + Planway
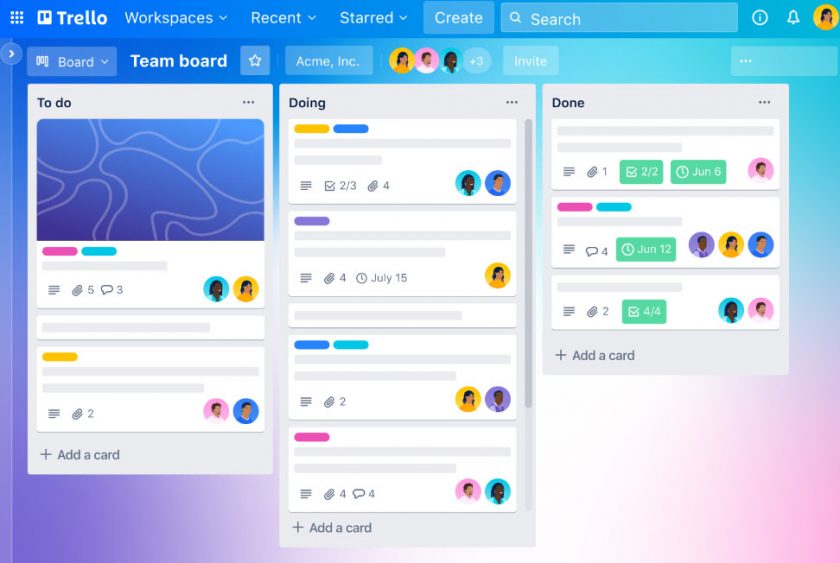
Trello is a card-based project management tool designed to offer visual and simple project management. For creating Gantt charts, Trello can be extended with power-ups such as Planyway, which add a time view to the tasks on the boards. This integration allows users to transform classic Trello cards into elements that can be planned on a timeline.
The Gantt view obtained through power-ups allows for better management of deadlines, dependencies between tasks, and the distribution of work over time. Each task (card) can be assigned to team members, given start and end dates, and monitored visually in the context of the overall project. This helps maintain consistency between the initial plan and actual progress.
Trello is especially useful for teams that already use a Kanban or Agile methodology, thanks to its flexibility and ease of use. Although Gantt features are additional and not native, integration with external tools makes it a good choice for those looking for a compromise between agile methods and Gantt planning.
Key features:
- Management of start dates and deadlines;
- Assignment of team members to each activity;
- Progress tracking and shared timeline;
- Drag & drop activities onto the timeline;
- Automation with Butler for repetitive activities;
- Notifications and integration with tools such as Slack, Google Calendar, etc.
Price: starting from $9 user/month.
Pros: intuitive interface, suitable even for those with no project management experience.
Cons: unsuitable for managing highly complex or long-term projects.
A lightweight but effective visual solution for project planning.
4. Toggl Plan
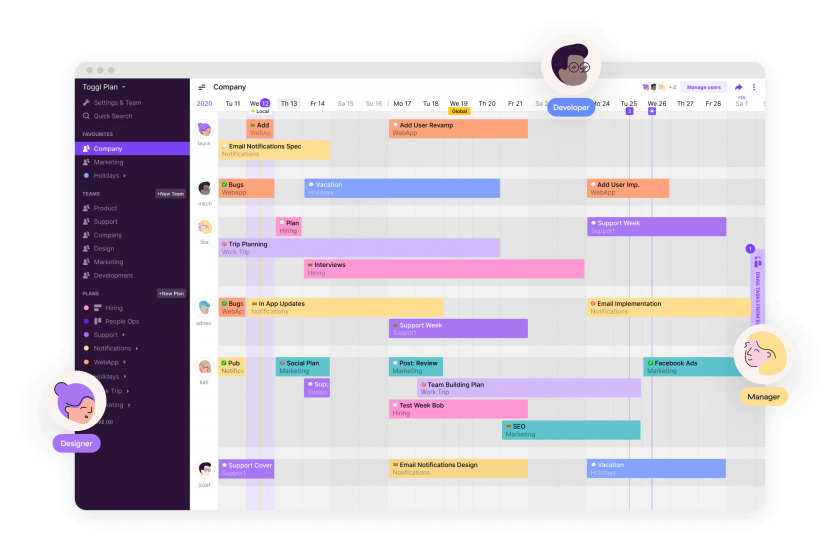
Toggl Plan places a strong emphasis on human resource management within projects, offering tools designed to optimise individual and team work organisation. Its structure is particularly useful for those involved in coordinating people rather than just activities.
One of its strengths is the integrated Gantt editor, which allows you to easily plan tasks and assignments, simplifying the distribution of activities over time. However, management is not limited to the project timeline, but also extends to the scheduling of the resources themselves.
A distinctive feature of Toggl is the ability to create Gantt charts focused on resources as well as projects. This makes it particularly suitable for those tasked with balancing workloads and optimising the use of human resources within the organisation.
Key features:
- Estimated progress vs actual progress;
- 4 zoom levels;
- Drag and drop for duration and dependencies;
- Customisation of assignment colours;
- Data sharing, even with external users;
- Integration with resource loading with side-by-side view.
Price: starting from $9 user/month.
Pros: good tool for human resource planning, with Gantt charts also focused on individual workloads.
Cons: perhaps due to its simplicity, it is less suitable for managing complex technical projects or those with many dependencies.
Simple and user-friendly, most useful if projects are planned based on resource capacity.
5. GanttPRO
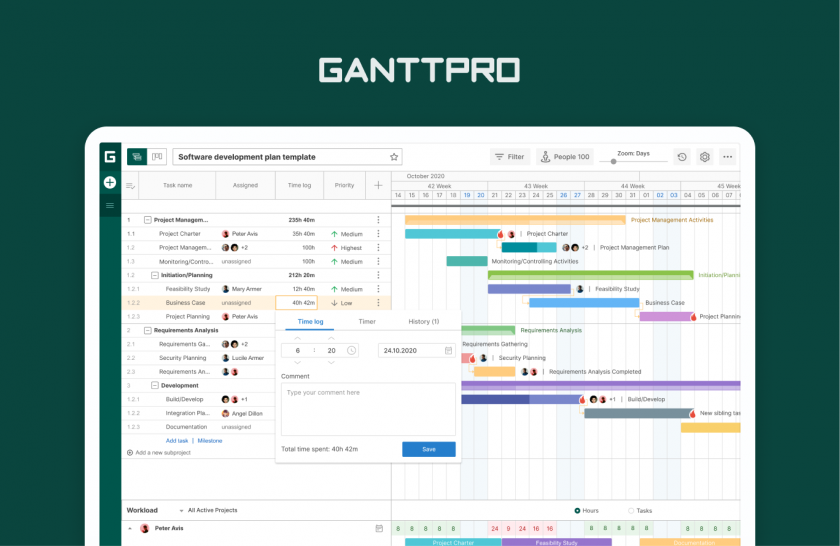
GanttPRO stands out for its approach that is entirely focused on management through Gantt charts, in stark contrast to other more generic tools. As the name suggests, it is designed to offer visual and detailed project planning from the very first use.
The work structure is based on the Gantt view as a starting point, accompanied by a WBS (Work Breakdown Structure) that allows the project to be divided into activities and sub-activities. Users can thus easily build a hierarchy of tasks and organise their work in an orderly and consistent manner.
In addition to Gantt charts, the software also offers additional views, such as Kanban boards, workload management and reporting tools. However, advanced features such as cost control and time tracking are only available with more comprehensive paid plans.
Key features:
- Fixed hierarchy consisting of projects and task lists;
- Option to create different baselines;
- Percentage completed can be set on the task by dragging;
- Dependencies with Finish to Start or Start to Start types;
- Gap between dependencies can be set in hours;
- Critical path.
Price: starting from $7 user/month.
Pros: fully Gantt chart-oriented, it offers clear and easy planning even for those who are not experts in project management.
Cons: less suitable for managing non-linear workflows, somewhat outdated graphics.
Specific tool to create Gantt charts but lacking in integration with other management tools.
6. TeamGantt
TeamGantt also adopts a Gantt chart-centric approach, which is the starting point for every new project. From the outset, the interface guides the user through the scheduling process, making the Gantt chart the operational heart of the tool.
Activities are added later, along with their assignment to team members. Most operations can be performed directly from the Gantt view, which allows users to edit, move or update activities with just a few clicks, providing immediate visual management.
However, the tool has some limitations. Tasks and ToDo’s are not differentiated, which can create confusion when managing activities. In addition, all activities related to a project remain visible on the timeline, which can complicate reading and organisation in more complex projects.
Key features:
- Ability to add notes and attachments to stages;
- Manual or automatic entry of completion percentage;
- Workload view linked to Gantt chart;
- Total view of the number of tasks assigned in hours or days;
- Health report;
- Secondary views: list, calendar and board.
Price: starting from $49 manager/month.
Pros: detailed and specific tool for creating Gantt charts, with some customisation options and good collaboration.
Cons: lack of certain types of dependencies and absence of the concept of elasticity. Poor overview.
Suitable tool for those who need to create many Gantt charts for small projects, but somewhat lacking in more complex cases.
Bottom line
As we have seen, in 2026 there are several software tools available to help you create a good Gantt chart that keeps pace with the evolution of this tool over time.
In this short but detailed list, we have tried to provide you with a general overview of the main features of the best tools to create your Gantt chart, to help you choose the one that best suits your specific needs.
We have also highlighted the some extra but crucial points in implementing the Gantt chart, which, if not overlooked, will allow you to use this tool throughout the entire project life cycle.
To sum up, keep in mind that:
- A good Gantt chart is now suitable for any type of work, whether it is Waterfall or Agile. You just need to find tools that are flexible and adaptable to your business needs.
- Having a precise and shared schedule helps the entire team align on project status and objectives, so favour systems that facilitate sharing.
- The ability to have an updatable timeline that also allows you to trace back to the planned situation at any time, right from the start of the project, is essential.
Twproject has all this and much more: that’s why it ranks first among the best Gantt chart creation software tools.
If you like, you can tell us if this analysis was useful and start creating a Gantt chart right away with all the tools and features offered by Twproject.
Try Twproject free for the first 15 days and plan your projects with ease and precision!

