The PERT diagram is a project management tool used to plan, organize and coordinate activities within a project.
PERT stands for “Program Evaluation Review Technique“, a methodology developed by the Navy in 1957 to manage the Polaris submarine missile program.
The PERT method focuses on the important dates and deadlines of a project, known as milestones
The most important milestone is, without a doubt, the final expiration date, when the project must be complete.
CONTENT INDEX
The Pert Diagram or three-point estimation
The project manager identifies the activities that must be performed in sequence, known as serial or dependent tasks, and those that can be performed simultaneously, known as parallel or concurrent activities.
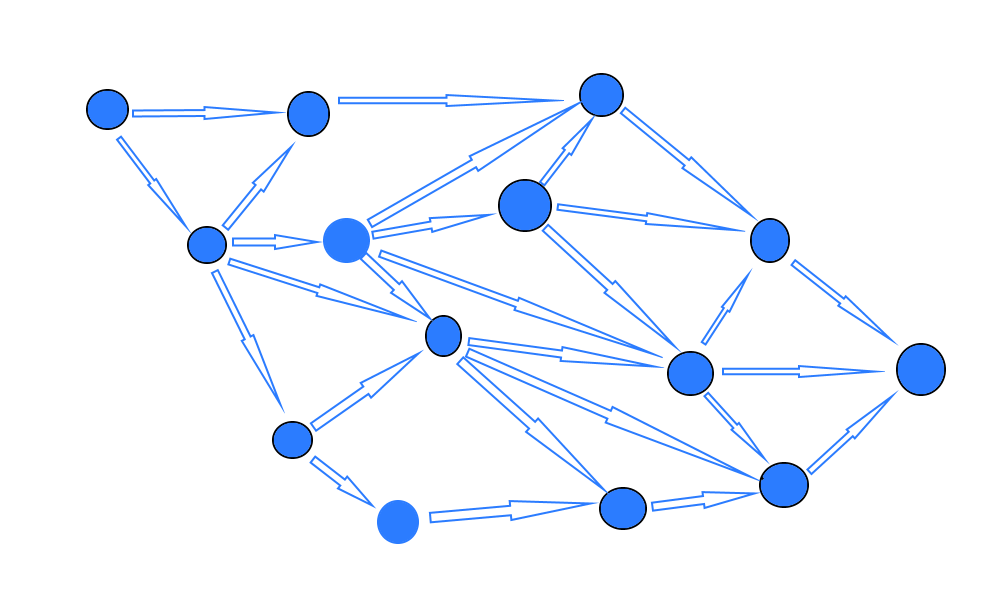
In the PERT diagram, the project is plotted on a flowchart where the nodes are deadlines and the arrows represent dependent activities.
Dependencies are represented by linked paths that move from left to right. A traditional PERT analysis provides on average three different deadlines: the shortest, that is the optimal estimate, the most realistic, that is the probable estimate, and the pessimistic estimate.
For this reason the PERT is also called “three-point estimation“.
The exact formula for defining deadlines is:
(optimistic time + (4 times more likely) + pessimistic time) / 6
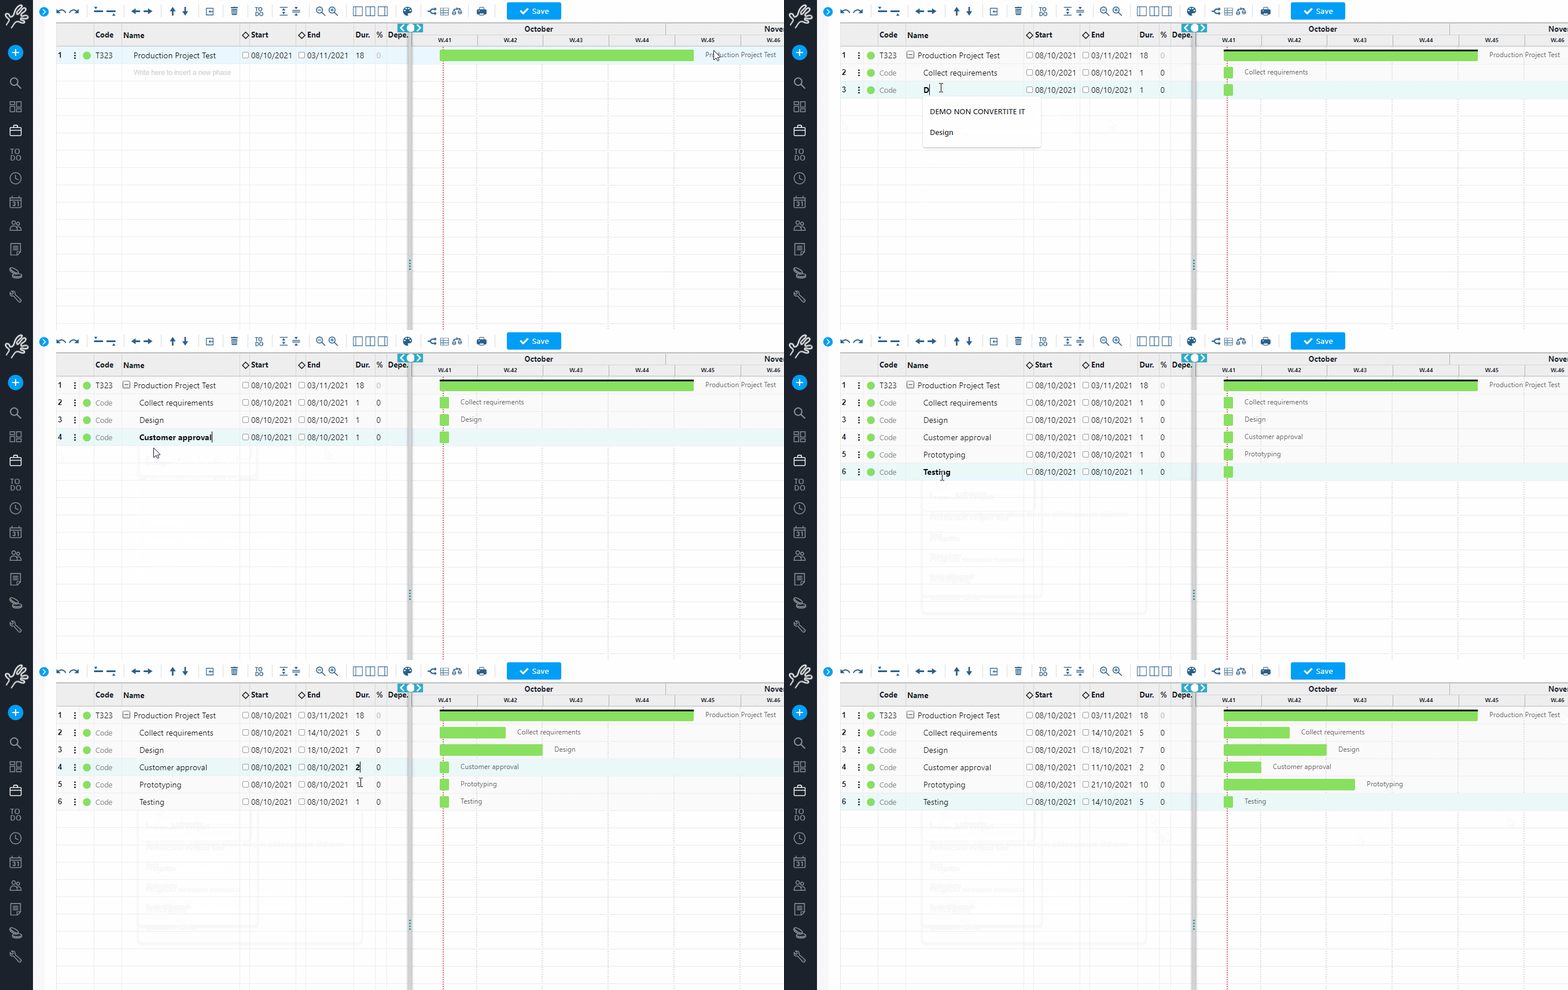
It is also possible to track PERT analysis results on a Gantt chart, which shows durations and dependencies.
The PERT diagram can help you during the project planning phase and the Gantt chart can plot time as the project progresses.
In simple words, a PERT diagram is a graphical representation of a project program.
Some of the advantages of the PERT diagram include:
- Making uncertain deadlines foreseeable;
- Defining a clear order to complete the activities;
- Making dependencies explicit.
But there is an important disadvantage: if the calculations are inaccurate, any delay will create a block or a slowdown that will inevitably affect the final delivery date.
However, if you are looking to have a structure and reduce uncertainty in project planning, the PERT diagram will help to establish important milestones and the activities necessary to achieve them.
How does a PERT diagram look like
Planning is shown as a network diagram. The activities are represented by nodes, with a circular or rectangular shape, which define the most important activities or milestones. Instead, the vectors or directional lines illustrate the sequence of activities.

The direction of the arrows on the lines indicates the sequence of tasks.
The pert – program evaluation and review technique – is sometimes preferred over the Gantt chart, because it clearly illustrates the dependencies of the activities.
Both tools are often used in the project management of activities.
A network diagram shows the sequence of activities and milestones. However, it also illustrates how priorities and milestones are linked, ie their temporal succession.
It is therefore also supportive in the development of the critical path method.
On the other hand, the PERT diagram can be much harder to interpret, especially in the case of complex projects.
One of the challenges to be faced with this diagram is that many information is shown for each activity, including:
- Activity name
- Expected and effective start
- Estimated Duration
- Name of the responsible person
This level of detail can quickly get out of hand when dealing with long and complex projects. We are talking about projects that have a high volume of activities with several phases and pivotal points.
One suggestion is to use a PERT diagram with the activities and milestones related to specific teams and / or departments, thus preventing the PERT chart from becoming overly complicated.
What are the pros and cons of PERT diagrams?
PERT diagrams have advantages, but managers must also be aware of the disadvantages when evaluating their use.
Here are the advantages:
1) Activity analysis
A project manager displays information on the likely completion of a project respecting time and budget costraints, displaying PERT activities and events independently and in combination.
For example, the implementation of a software requires the completion of critical tasks such as hardware installation, programming, system testing and training of users. Using a PERT diagram, a project manager can evaluate the completion time and the resources needed for each of these activities.
2) Coordination of the department and members
The PERT analysis improves planning and decision making by integrating and presenting data from multiple departments.
Collecting qualitative and quantitative data from multiple sources also helps to coordinate project activities and improves communication between departments.
PERT identifies the responsible departments and the role of each subject in the project.
The visibility of the areas of responsibility encourages the commitment of the direction towards the project. In addition, the PERT diagram reveals interdependencies of activity and contributes to the development of a general plan that provides a current view of business operations.
3) What-if Analysis
The PERT diagram requires that the project activities are sequenced in a network under a set of rules that specify critical paths (critical path method).
The critical path is the longest sequence of activities and events – milestone – in the project and determines the number of days needed for completion.
A What-if analysis identifies possibilities and uncertainties related to the project activities.
Various combinations of activities are attempted and the most useful possibility is selected, minimizing the project’s surprises and waste.
The What-if analysis also highlights the activities with the greatest risk that require careful monitoring during the project.
Now let’s move on to the disadvantages of using a PERT diagram:
1) Subjective analysis
The PERT method requires the identification of the activities of a new project and the arrangement of the activities in time sequence.
As a result, the process of collecting and analyzing data is subjective. This subjectivity can result in a PERT diagram with equivocal estimates of both time and cost.
The data may not be reliable as they reflect the judgment of the project participants who provide input to the analysis.
Companies base effective decisions on relevant information that is often historical. Estimates of project time and resources, as well as the probability of timely completion, in this case, may therefore not be reliable.
2) The focus is on time
The PERT method is an analysis of the time network that determines the need for labor, materials and capital goods for the individual activities of the project.
Cost estimates are developed for each activity in the network. However, PERT is primarily a time-focused method.
The diagrams specify the time required to complete each project activity and the tasks that must be completed to meet the project completion date.
3) Intensive resource investment
A PERT analysis requires a detailed study of the project activities and the feedback of many people from different organizations.
Moreover, the PERT is a complicated method to implement, especially for beginners. The high intensity of the work required to execute a PERT diagram can make this type of method expensive.
The PERT diagram therefore has advantages and disadvantages, and the project manager has to evaluate whether its use will be necessary or not for the project.
However, it is still a method that will certainly help in the planning and management of the project and that will bring a certain amount of extra security.
How to create a Pert diagram with Twproject
Twproject stands out in the project management software landscape for its ability to simplify the creation and management of Pert diagrams.
- Activity definition: start by identifying all the key activities of your project. Twproject allows you to define and organise the work of your team, making it easier to plan and prioritise activities.
- Diagram structuring: Use Twproject’s planning tools, such as the Gantt diagram, to structure your Pert diagram. You can represent activities as nodes and define dependencies between them.

- Resource management: you can easily monitor workload and resource planning. This helps you identify who is overloaded or underemployed and make adjustments accordingly.
- Analysis and monitoring: analyse the critical path of your project and monitor progress in real time in order to proactively identify and manage risks.
- Collaboration and updates: keep your team informed and involved. Twproject facilitates collaboration and communication within your team, allowing you to share updates and changes to the Pert chart efficiently.
Con Twproject puoi creare diagrammi di Pert efficaci e gestire complessivamente i progetti in modo più efficiente, sfruttando una suite di strumenti integrati per la pianificazione, il monitoraggio e la collaborazione.


